Hi
can someone help me understand how to represent these values?

Hi @Fra
From just the screenshot it is hard to understand what you have there. The definition of the report and a description would help anyone to answer your question better.
Kind regards,
Roberts // eazyBI support
Hi Roberts
the table showing how many issues resolved after 1 hour, after 2 hour, after 3 hour until 1 day.
Can you help me to create a report like this.
Kind Regards
Francesco
You can try to use the Resolution Interval dimension, to show the number of issues resolved in specific intervals. Select the interval dimensions for import in the eazyBI import options “Additional options” tab.
After the import, select the Resolution interval dimension in columns of the report. Expand the dimension in the “All hierarchy level members” section and click on the “Edit” link. There you can specify the interval and the interval unit. See the picture below:
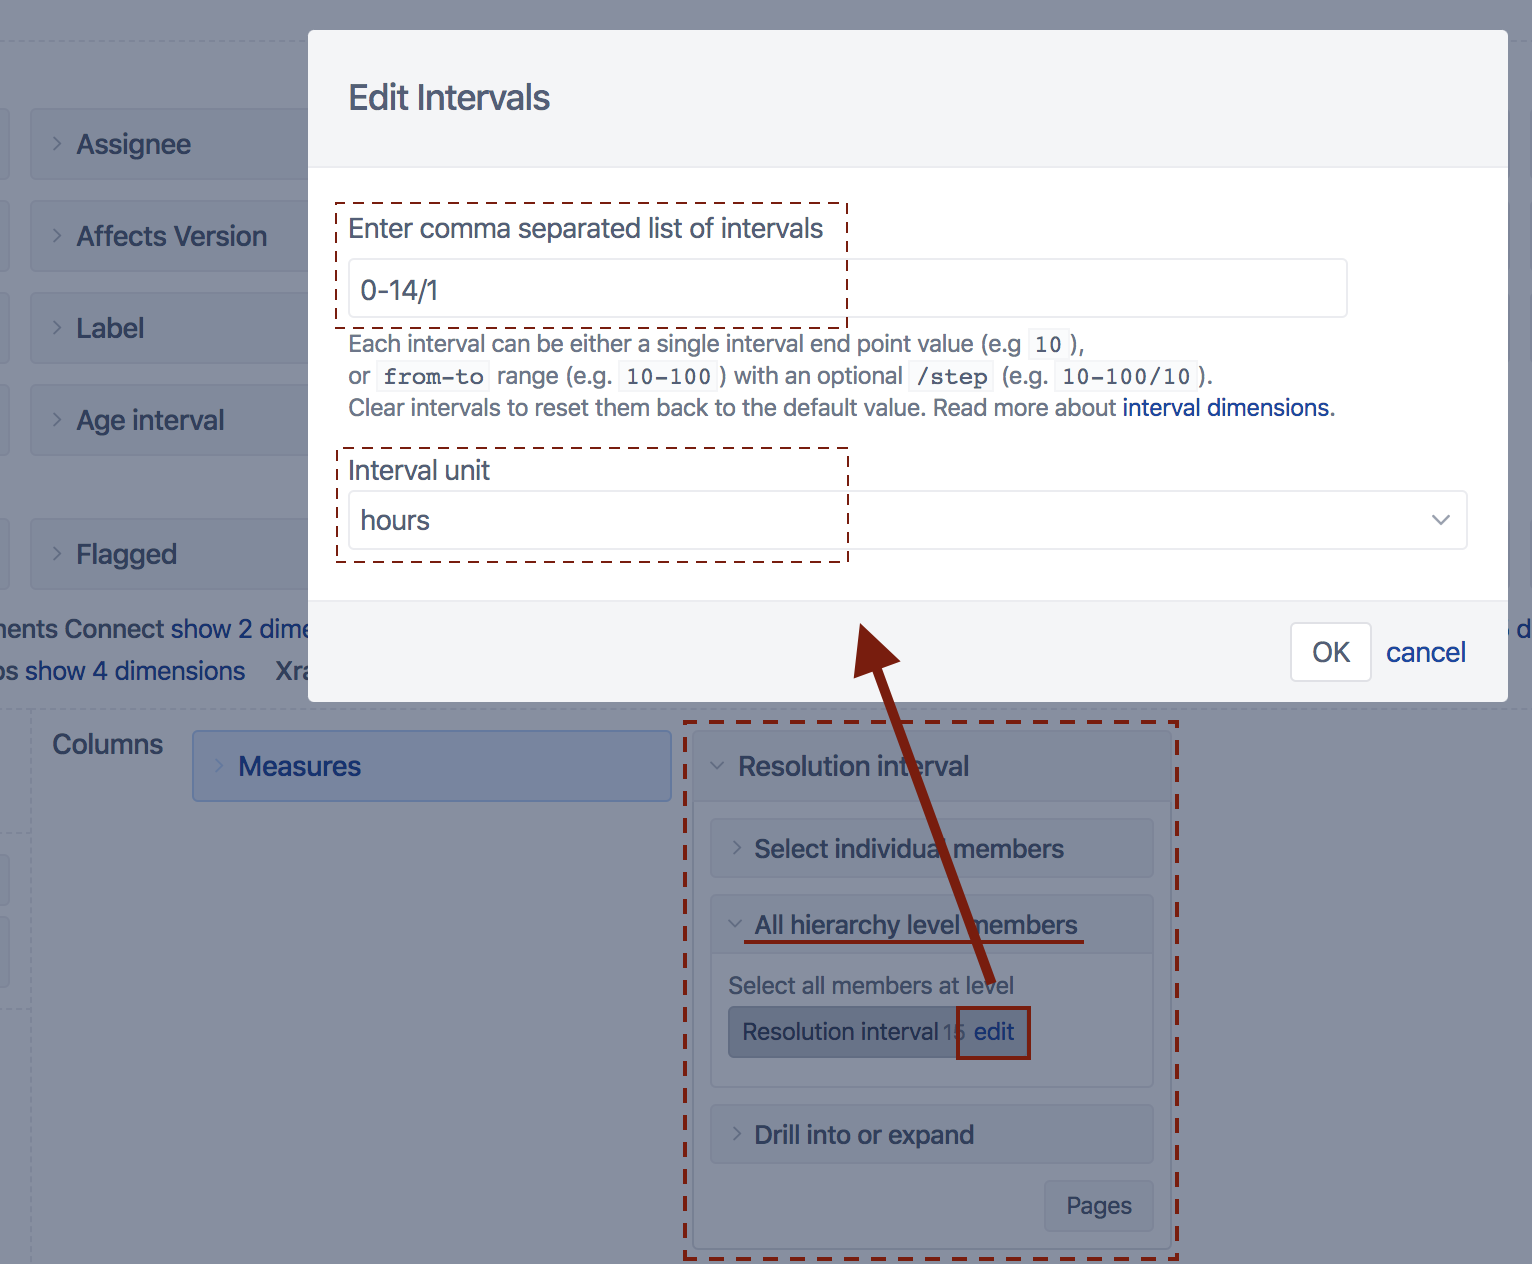
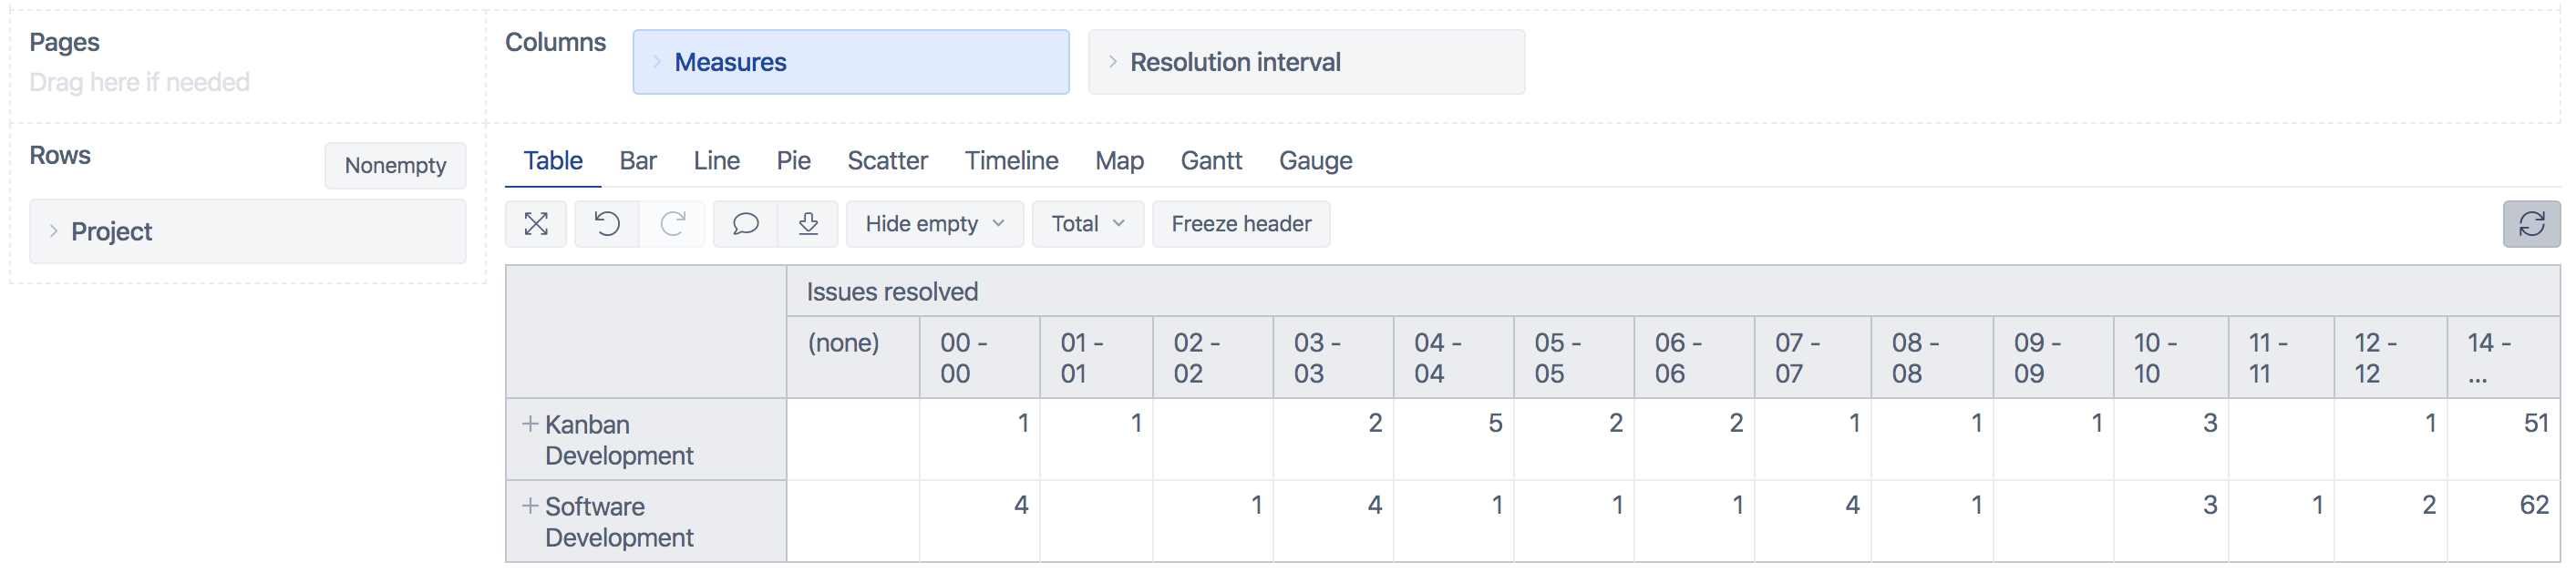
The settings in the picture above will create a member for each hour until 13, and the rest will be grouped in one member. Please see the picture of a sample report below:
Please have a look at the eazyBI documentation page for more information on this - https://docs.eazybi.com/eazybijira/analyze-and-visualize/interval-dimensions.
Best,
Roberts // support@eazybi.com