Calculation Bug Leveraging Time Dimension?

Hi everyone, here is the context.

Create a report with Time Dimension in Rows, Project and Issue Type in Pages, and Measures in columns.

Select Spike, Story, and Bug for Issue Type and the specific project you wish to target if you have multiple projects in your cube. If you only have one project in your cube then this is unnecessary.

Select the Quarter member in time and “Story Points resolved” and “Issues resolved” in Measures dimension.

Create a custom calculated member that divides “Story Points resolved” by “Issues resolved” to get the average points per issue.

This works just fine, but the calculation includes issues that don’t have story points which skews the numbers. So, I created another custom calculated member to filter out the issues that don’t have story points so that I can get an appropriate count.

Aggregate(
Filter([Issue].[Issue].members,
NOT isEmpty([Measures].[Issue Story Points])
AND DateInPeriod(
[Issue].CurrentMember.getProperty(“Resolved at”),
[Time].CurrentMember
)
)
)

Separately, run the following JQL and note the count of issues returned.

project = “EazyBI project name” AND resolutiondate >= 2018-07-01 AND “Story Points” is NOT EMPTY and issuetype in (Story, Spike, Bug) ORDER BY resolutiondate ASC

That will return the number of resolved stories, spikes, and bugs within the current quarter (Q3 2018).

Compare that number with the number of issues returned for the calculated member and you may notice a discrepancy.

Now, create another custom calculated member where rather than deriving the date range from the Time dimension, you declare it directly.

Sum(
{PreviousPeriods([Time].CurrentHierarchyMember), [Time].CurrentHierarchyMember},
Aggregate(
Filter([Issue].[Issue].members,
NOT isEmpty([Measures].[Issue Story Points])
AND DateBetween([Issue].CurrentMember.getProperty(“Resolved at”),
‘2018-07-01’,
now()
)
)
)
)

You’ll notice that for the Q3 period, it now returns the appropriate number of issues in Q3 that have been resolved that have story points assigned to them.

You can test this by changing the date range as well. Change to the Q2 date range and it’ll show the appropriate aggregation for that date range.

But if you leverage [Time].CurrentHierarchyMember.StartDate, for example, or some other dynamic definition of date range, the calculation ends up wrong.

After digging in, I found that when leveraging the Time dimension declaration, it only calculates issues that were resolved in that particular time declaration AND CREATED in that particular time declaration as well.

In other words, if Issue #1 was created in Q2 but resolved in Q3, using the Time declaration to derive the date bound will cause it to not be counted. However, if you declare the dates directly, Issue #1 will be counted properly.

That is the expected behavior, the same behavior as happens when you do a JQL search.

So, is there something that I’m doing here incorrectly, or is this a bug in how Time dimension context skews custom calculations?

Thanks for any help here!

– Malik Graves-Pryor

Hi,

Just reaching out to see if any eazybi folk have been able to replicate this. thanks!

–Malik Graves-Pryor

Trying one more time, will just reach out to EazyBI support after this :slight_smile:

–Malik Graves-Pryor

Malik,

Sorry for letting you wait so long for the answer, and thank you very much for your patience and reminding about this.

The reason for why you do not receive the expected results is your use of the Aggregate function in your formula. Note that if you wish to get the numeric value from the Aggregate function, you should apply the correct parameter list: Aggregate(<Set>,<Measure>). Note, that there is another version of the Aggregate function Aggregate(<Set>) which is designed to have the aggregated members, and provides the dimension member as a result.

Once you use the Aggregate without any measure, it adds the default eazyBI Jira issues measure “Issues created” when evaluating the expression as a measure. In your report context (when you use the Time dimension) it results in the behavior as you describe; the issues are counted when those are both resolved (that is explicitly filtered in your condition) and created (which is the behavior of the “Issues created” measure when combined with time dimension).

Your version with the Sum (... PreviousPeriods.... works fine because it covers all the time range.

Now, let us have some alternatives of how you can count the issues with the story points.
You might use the Count function which requires only the set to be specified, like this:

Count(
Filter([Issue].[Issue].members,
NOT isEmpty([Measures].[Issue Story Points])
AND DateInPeriod(
[Issue].CurrentMember.getProperty("Resolved at"),
[Time].CurrentMember
)
)
)

A similar alternative would be to use a bit different way of iterating over the Issue dimension:

Count(
Filter(Descendants([Issue].CurrentMember,[Issue].[Issue]),
NOT isEmpty([Measures].[Issue Story Points])
AND DateInPeriod(
[Issue].CurrentMember.getProperty("Resolved at"),
[Time].CurrentHierarchyMember
)
)
)

Finally, there is an undocumented feature of eazyBI allowing to have the number of issues with story points by a standard measure. There is a hidden set of measures Issues with story points ... giving the number of the issues with story points by the issue creation, resolution, closure or due date. So, in your case the formula would be:

[Measures].[Issues with story points resolved]

Thanks again for sharing your use case, we are happy to know that users are trying out so different solutions with eazyBI.

Kindly,
Janis, eazyBI support

1 Like

Awesome, thank you Janis! Adding the [Measures].[Story Points resolved] numeric expression worked like a charm. It also gave me the flexibility to use the reuse the same function but instead use [Measures].[Issues resolved] for a separate calculated member.

I’m using this report to show how a decrease in the size of the individual story estimates leads to increased throughput in terms of the number of stories that are resolved on a per quarter basis as well as the number of story points that are completed.

This is a core component of Queuing Theory, so this report shows in reality what we teach in practice. When we break our stories into smaller chunks, the team is able to execute much more nimbly and actually get more work done by reducing batch size, and ultimately, queue length.

In conjunction I’ve created another report that shows the increase in story points on a rolling average of 30 days, and the linear regression trend line over the course of 1.5 years.

This way we can see the quarterly change in team performance as well as the long term trend. Is team performance improving in the short and long term, and is that improvement accelerating or decelerating.

This was the final piece, and that second declaration in the Aggregate function was just the ticket!

Muchly appreciated.

– Malik Graves-Pryor

Btw, having that undocumented feature be exposed would’ve saved the trouble of having to create the custom function in the first place. What other goodies are the good folk at EazyBI hiding? :slight_smile:

– Malik Graves-Pryor

We try to add those hidden pieces in our documentation, but I assume it might not be easy to find.

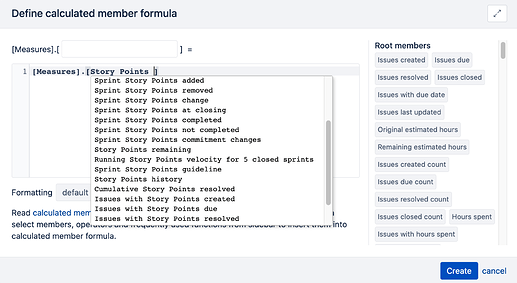
With version 6.2. we improved MDX autocomplete with a better search and representation of any measure including hidden measures. You can type in any custom field name, for example, Story Points , and autocomplete will show any measure, including hidden ones with the name story points. It might be a long list, though.

Daina / support@eazybi.com

1 Like