My team is trying to stop cases from reopening multiple times. I want to provide them a chart that shows the count of issues by the number of times they transitioned to the status Reopened. I will filter this by release. I feel like I just want to drag the “Transition to status issues count” to be a dimension. Help!
Hi @mkibrick
Welcome to the eazyBI community.
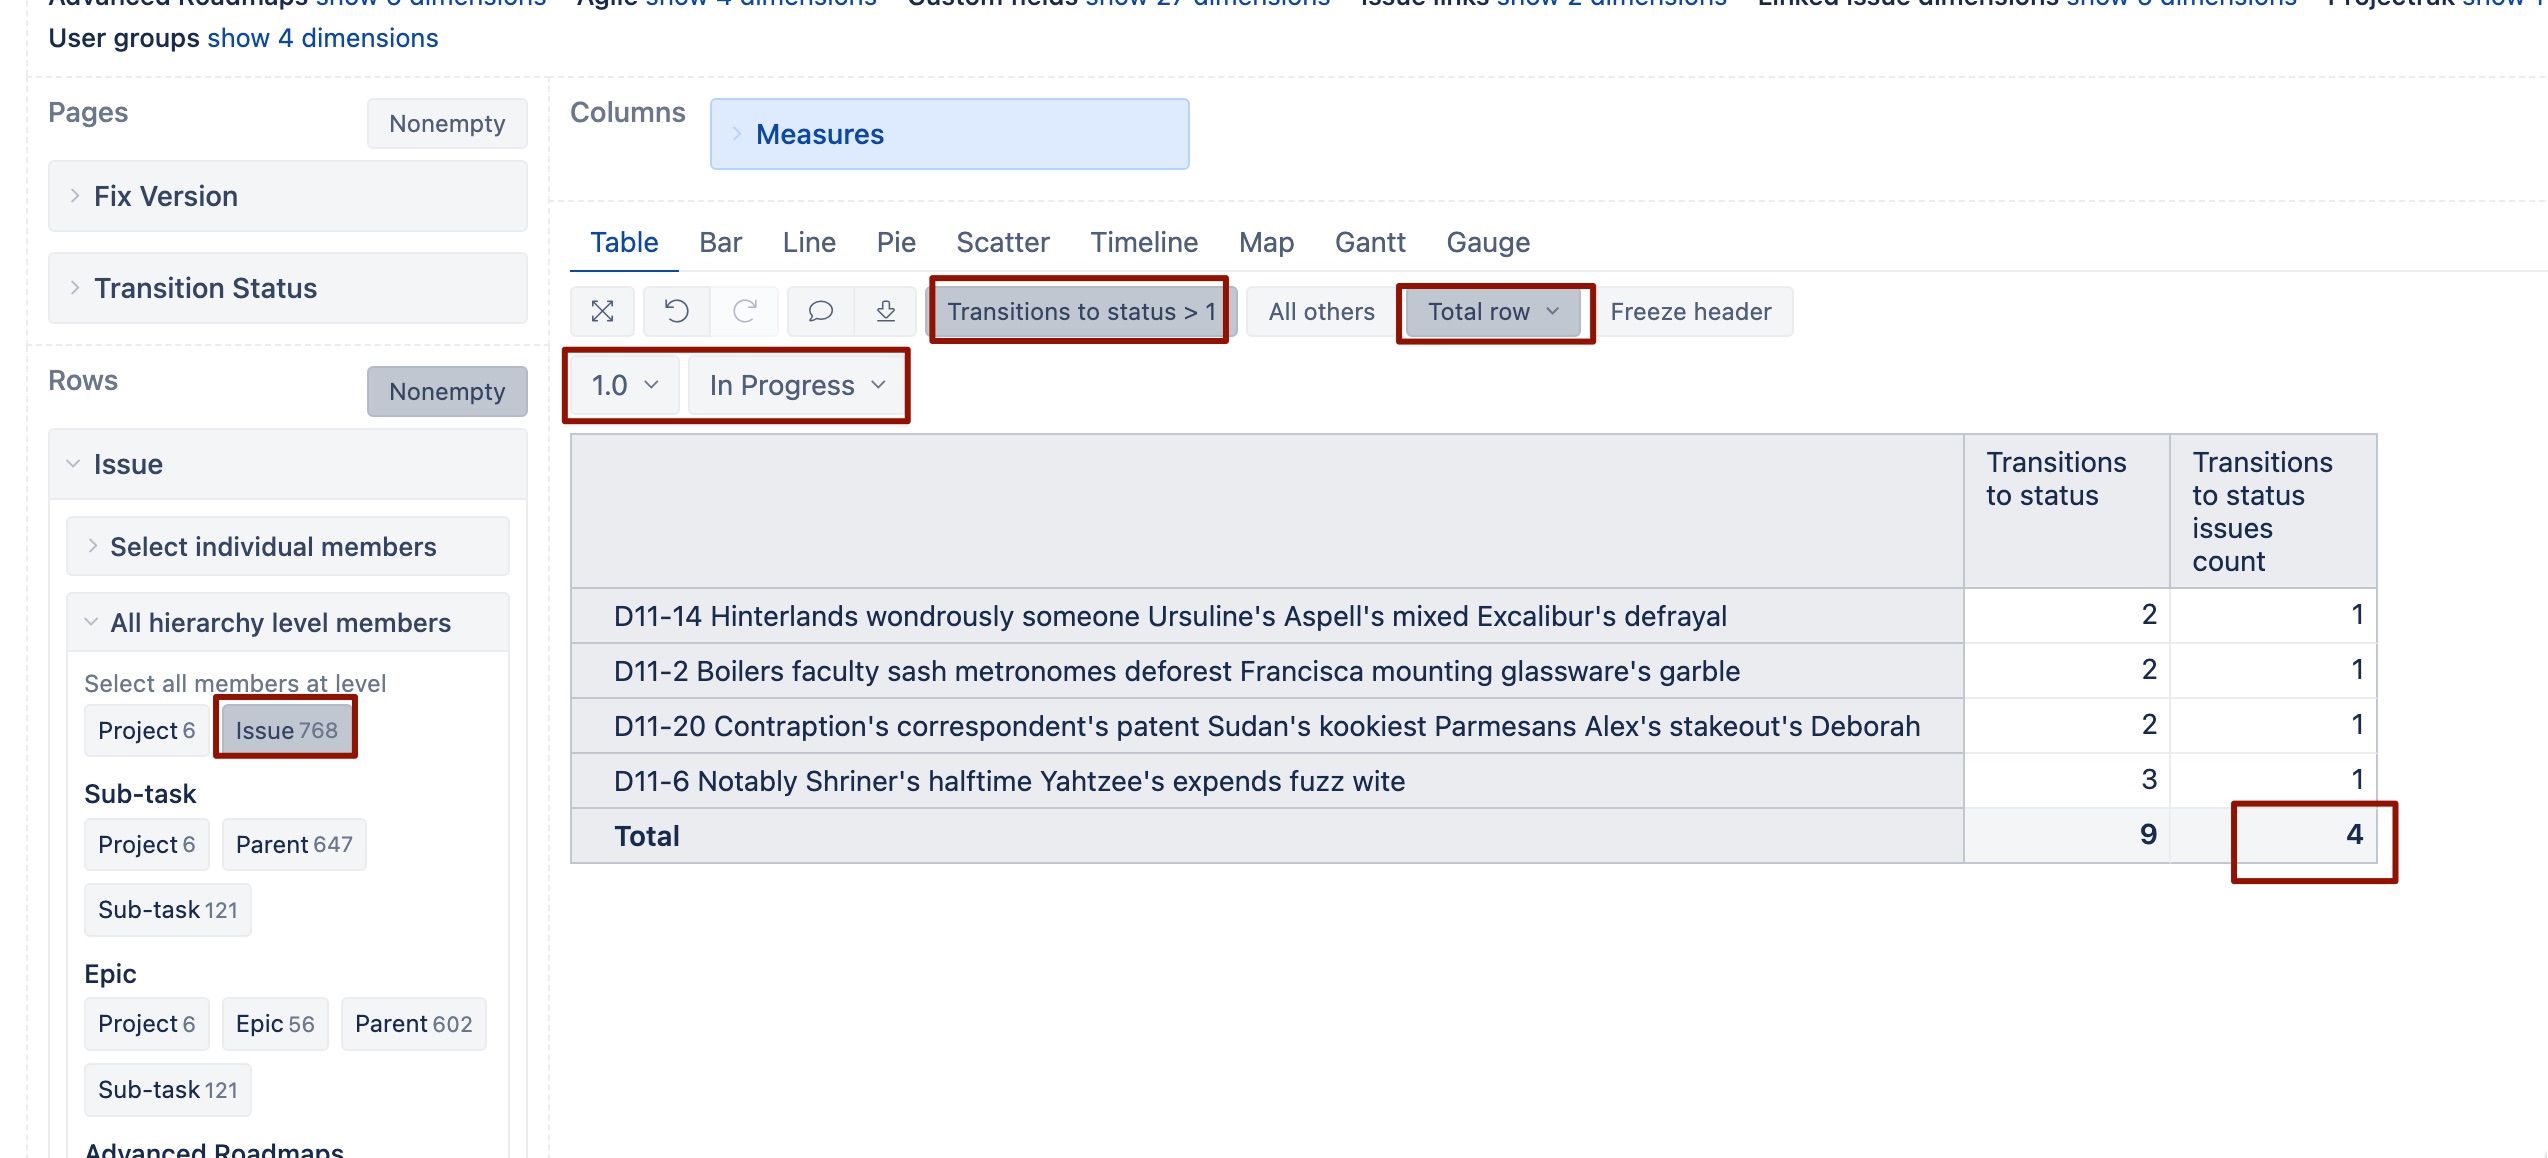
You can try creating an issue-level report with “Total” feature enabled and filter the report by “Transitions to status” measure.
Then show the count for “Transitions to status issues count” in the given report context.
If you filter the report by Fix version and Transition status dimensions, you should find the list of issues that transitioned to specific status multiple times.
Martins / eazyBI support