I have a requirement to have a count of Stories and count of Tasks and provide a combined hours spent for both rather than in two separate columns

Try the following:
- Create new calculated member on issue type as [Story + Task]=[Issue Type].[Story] +[Issue Type].[Task]
- Create new User Defined Dimension based on 1 with selected [issue closed]
- Add them to your page and ‘stacked’ them.
- Do the same for ‘Hours’
Hi,
The standard eazyBI behavior is to crosjoin all measures with all dimension members. To overcome that, there are few options.
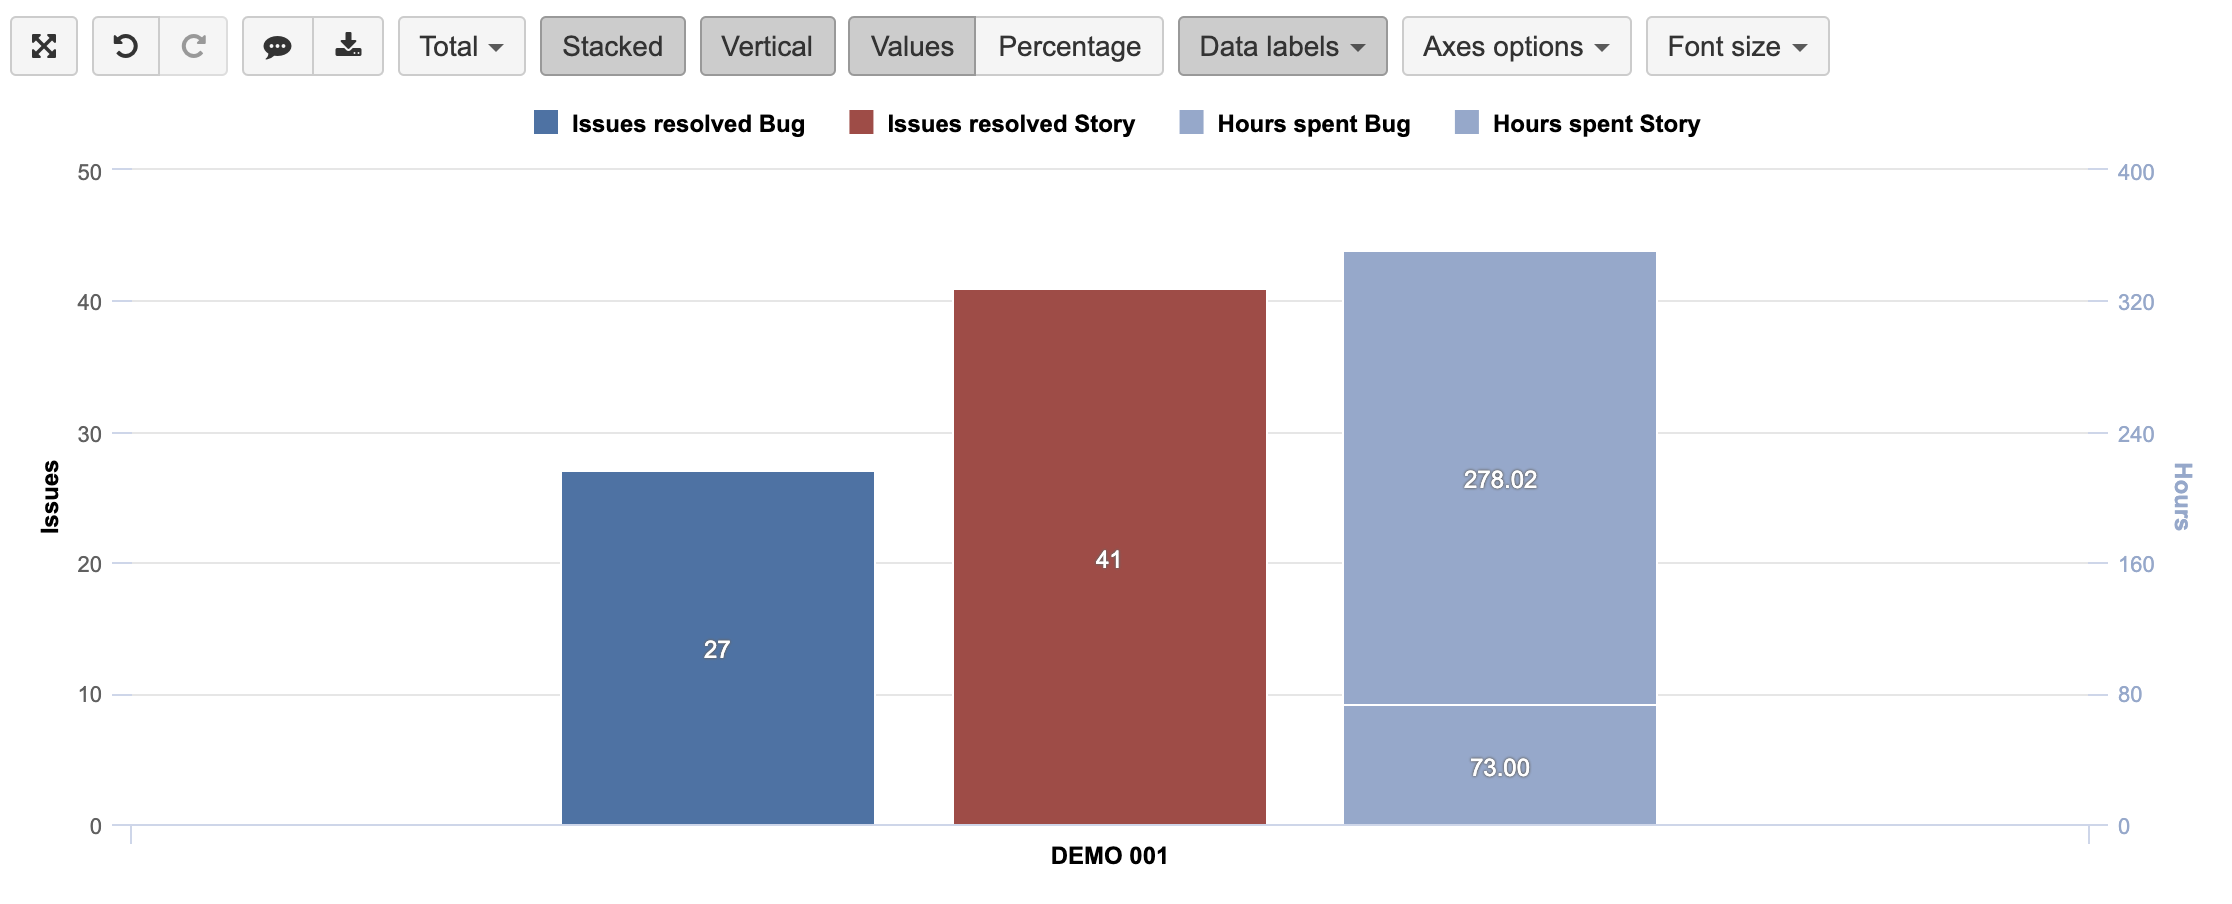
One option is using Bar chart option “Stacked” as mentioned below:
- The report table stays as you already have.
- Select “Stacked” for the whole chart (you would get stacked Issues closed and Hours spent)
- For “Issues closed Story” , click on the legend (color-box next to the label) and select Stacked > disable
4… You may set the same color for both stacked Hours spent columns.
Before all the steps, I would highly advise using a separate axis for both values with Hours spent, as the measurement is hours, not a count of issues.
Example report:
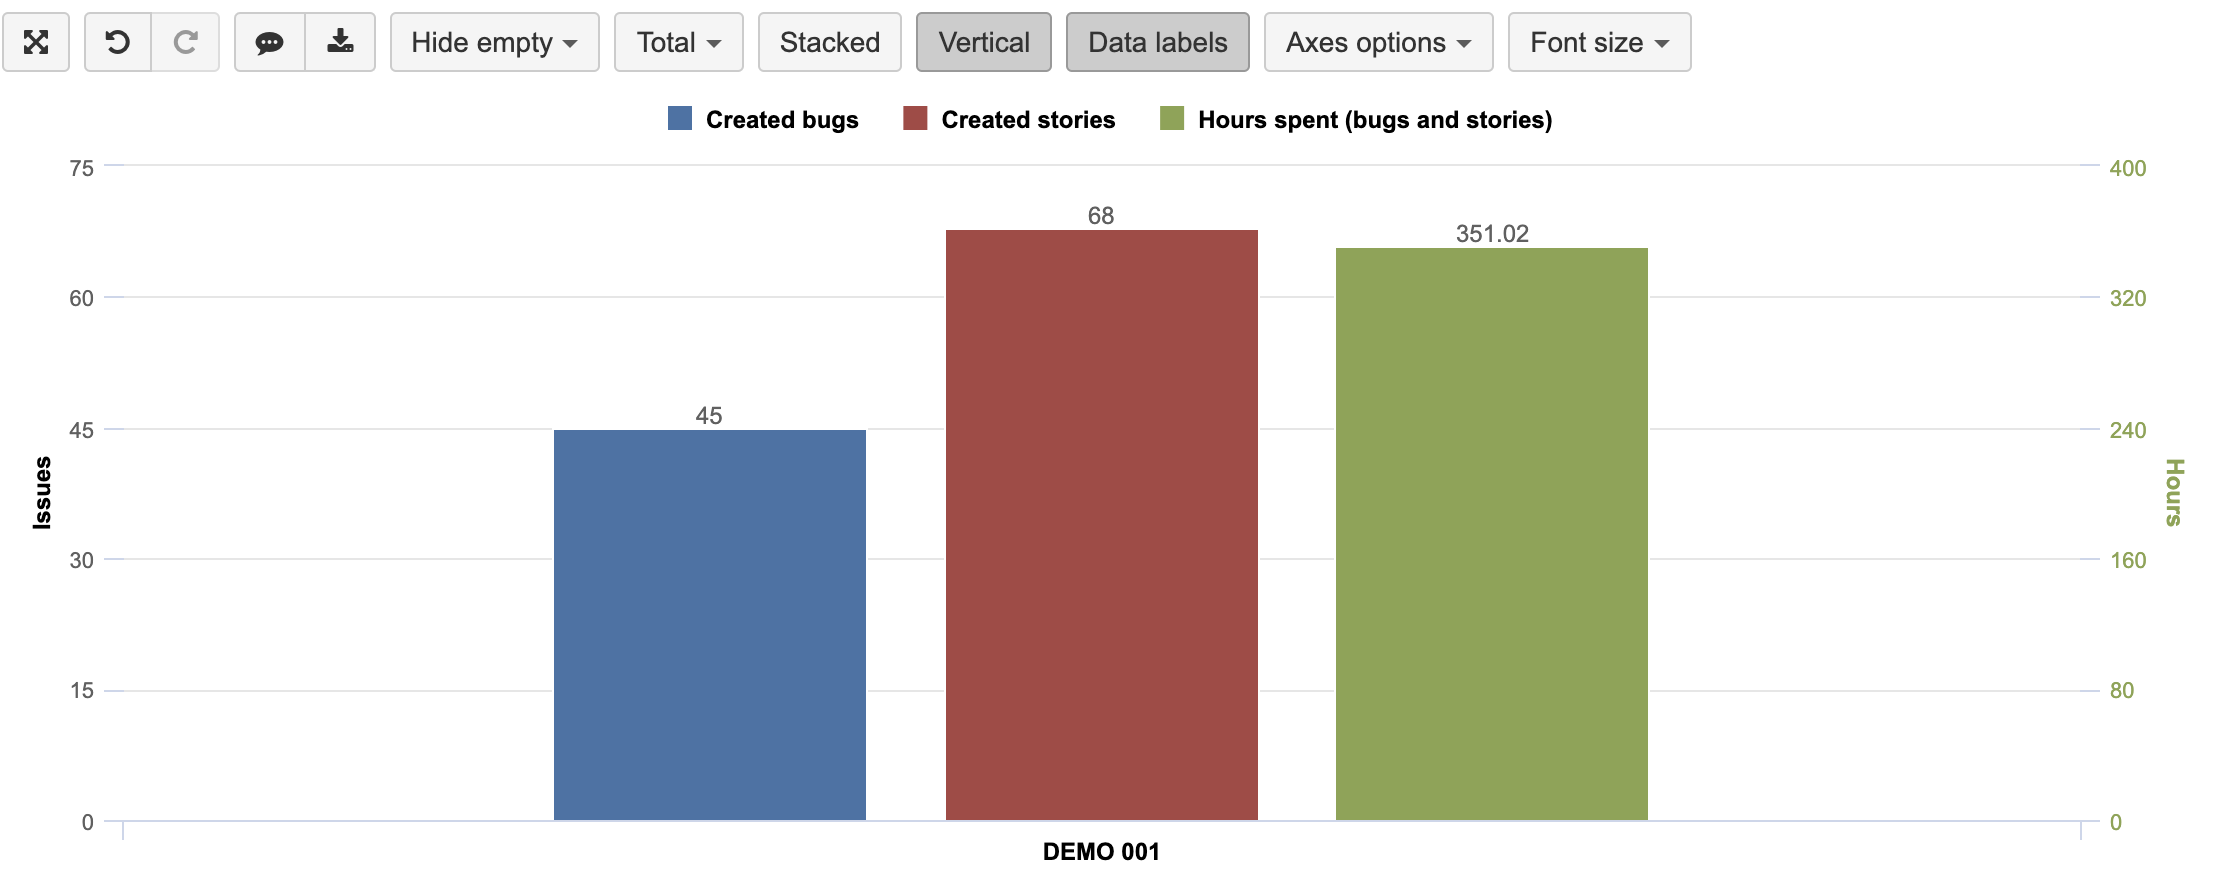
Another option is writing a new measure for each column:
1.Measures for closed issues (one for bugs, another for stories). Example for closed bugs:
([Measures].[Issues closed],
[Issue type].[Bug])
2.Measure for hours spent (bugs + story together):
([Measures].[Hours spent],
 [Issue type].[Bug])
+
([Measures].[Hours spent],
 [Issue type].[Bug])
Select those three measures in the report table (no need for Issues Type dimension, because types are already included in the measures) and then switch to the Bar chart view. Again, use a separate axis for hours spent.
Report example:
Best,
Ilze, support@eazybi.com