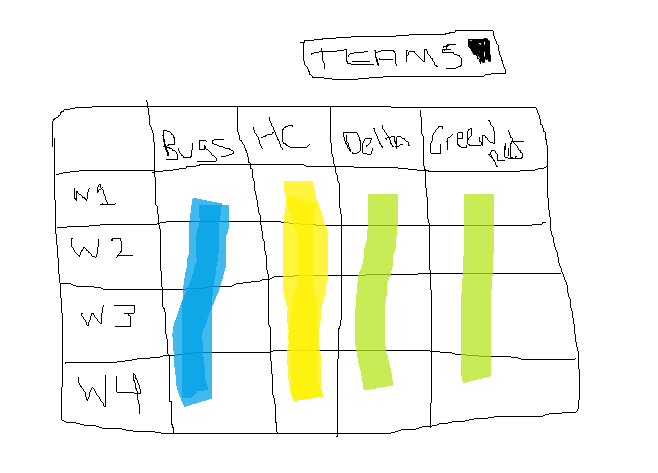
Good morning Team. Would appreciate some assistance with this current problem I’m trying to work through. Essentially, I’m trying to hardcode multiple values for a report only measure that pulls from two tables. Time: in Rows and Teams: in Columns. In my horrible drawing conception. I know the report for the BLUE column and I know how to make the measure for the GREEN columns.
Hardcoding the data for the YELLOW column is where I’m lost.
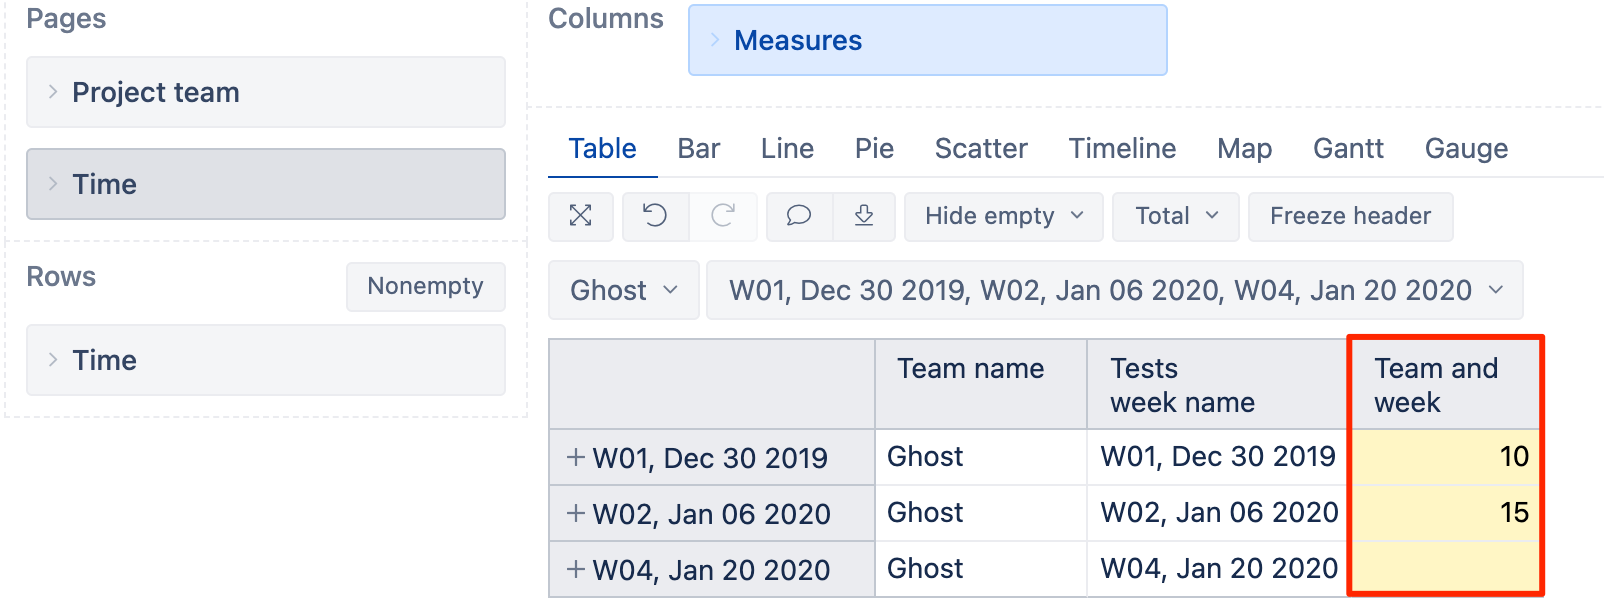
Is there a specific CASE example I can use that would pull the Week Rollup and then when I have the specific team selected… display a specific value that was hardcoded?
The Case would be… When X Team is selected (In columns) display the various static values in this COLUMN that corresponds to a specific weekly range in the associated ROW.
Thanks in advance! Have a great day.