Hi
Is it possible to produce a report in EazyBI like the following
As you can see in each cell we want to see a list of issue summaries rather than a count of issues.
Thanks
Chris
Hi
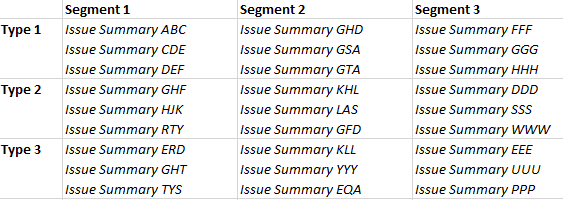
Is it possible to produce a report in EazyBI like the following
As you can see in each cell we want to see a list of issue summaries rather than a count of issues.
Thanks
Chris
Hi Chris,
To represent names of all issues that are behind the number of created issues, you may want to use function Generate():
 Generate(
 Filter(Descendants([Issue].CurrentMember, [Issue].[Issue]),
 --filter by properties related to dimensions selected in the report
  [Measures].[Issue type] = [Issue Type].CurrentMember.Name
  AND
  [Measures].[Issue segment] = [Segment].CurrentMember.Name
  AND
  [Measures].[Issues created]>0),
 [Issue].CurrentMember.Name, Chr(10)
)
Use correct names of properties and dimensions in the Filter part ([Measures].[Issue type] = [Issue Type].CurrentMember.Name and [Measures].[Issue segment] = [Segment].CurrentMember.Name)!
You may use another measure instead of “Issues created” regarding what issues you want to represent.
Note: This calculation can be slow as it iterates through all issues!
Best,
Ilze / support@eazybi.com