@gerda.grantina
Thanks, Gerda.
Let me try to clarify with screenshots
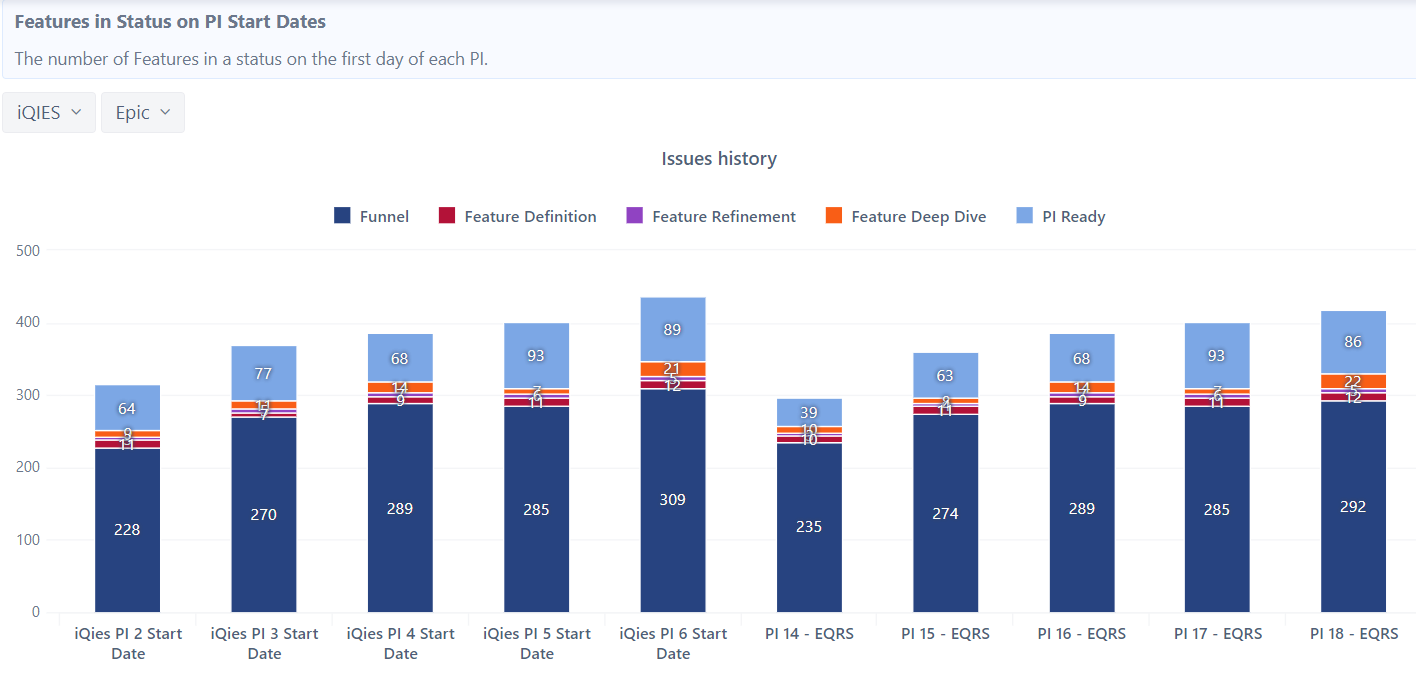
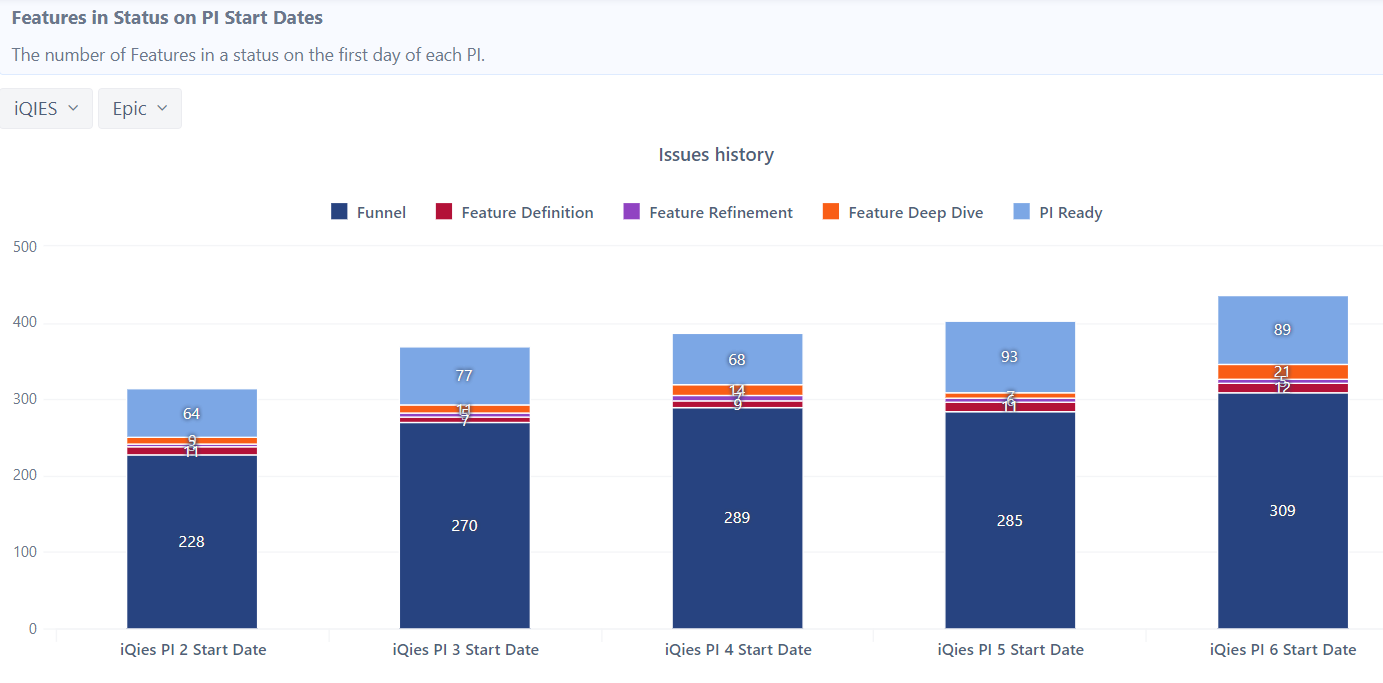
This is the current chart display
Notice it is showing the data for the number of features in status for iQies and EQRS
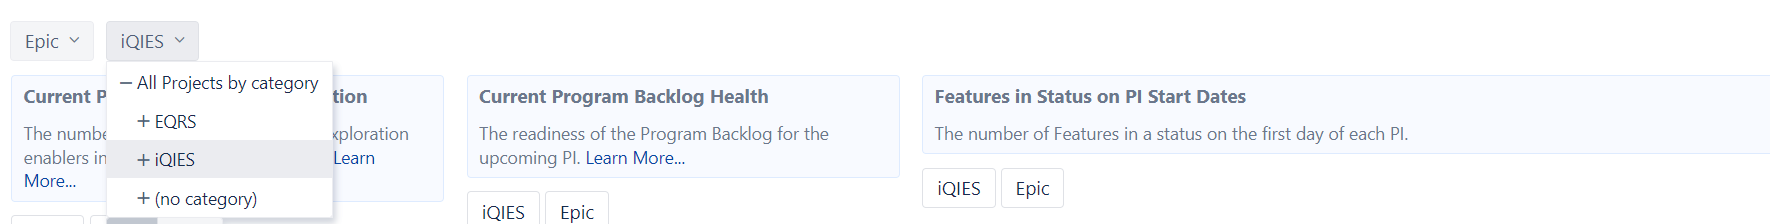
There is a common page selector for project by category, which has two values, iQies and EQRS
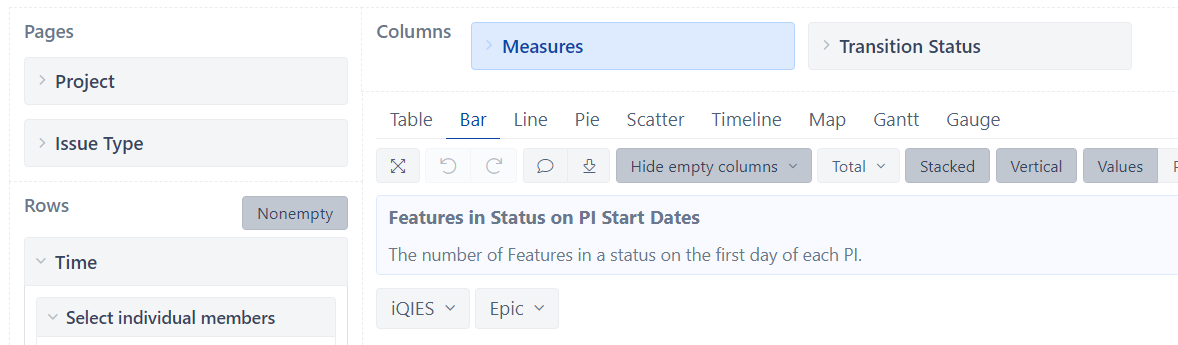
Time is in rows
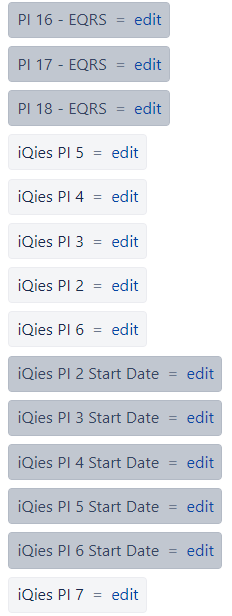
I have custom members in the time dimension
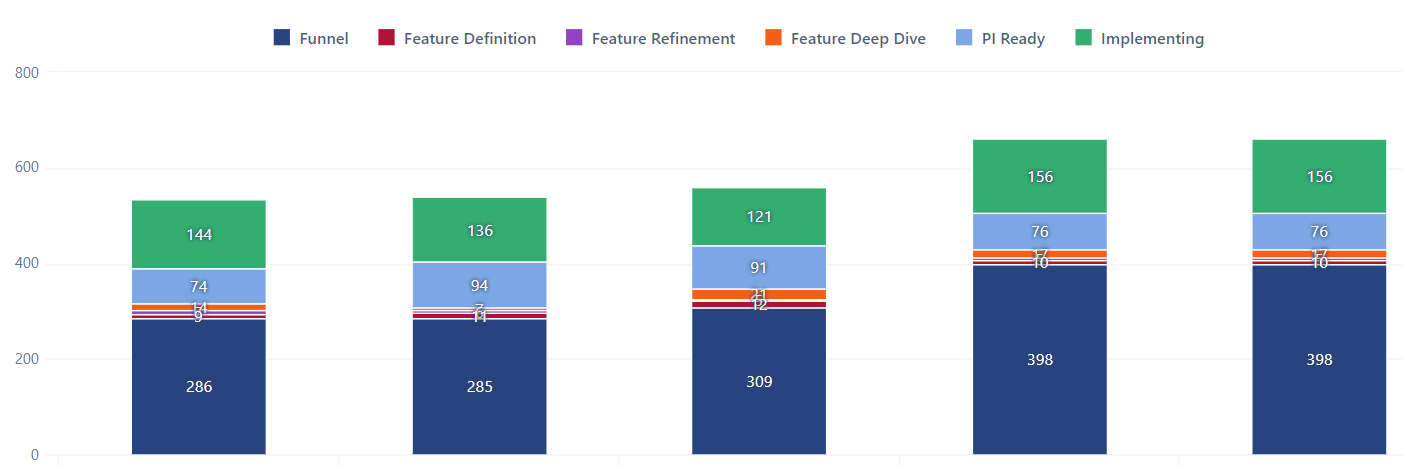
The desired result is, that when selecting a project from the common page selector for project, the report only shows members that match the project name. For example, if iQies is selected in the common page, I would see this
and if EQRS was chosen in the common page selector, I would see this:
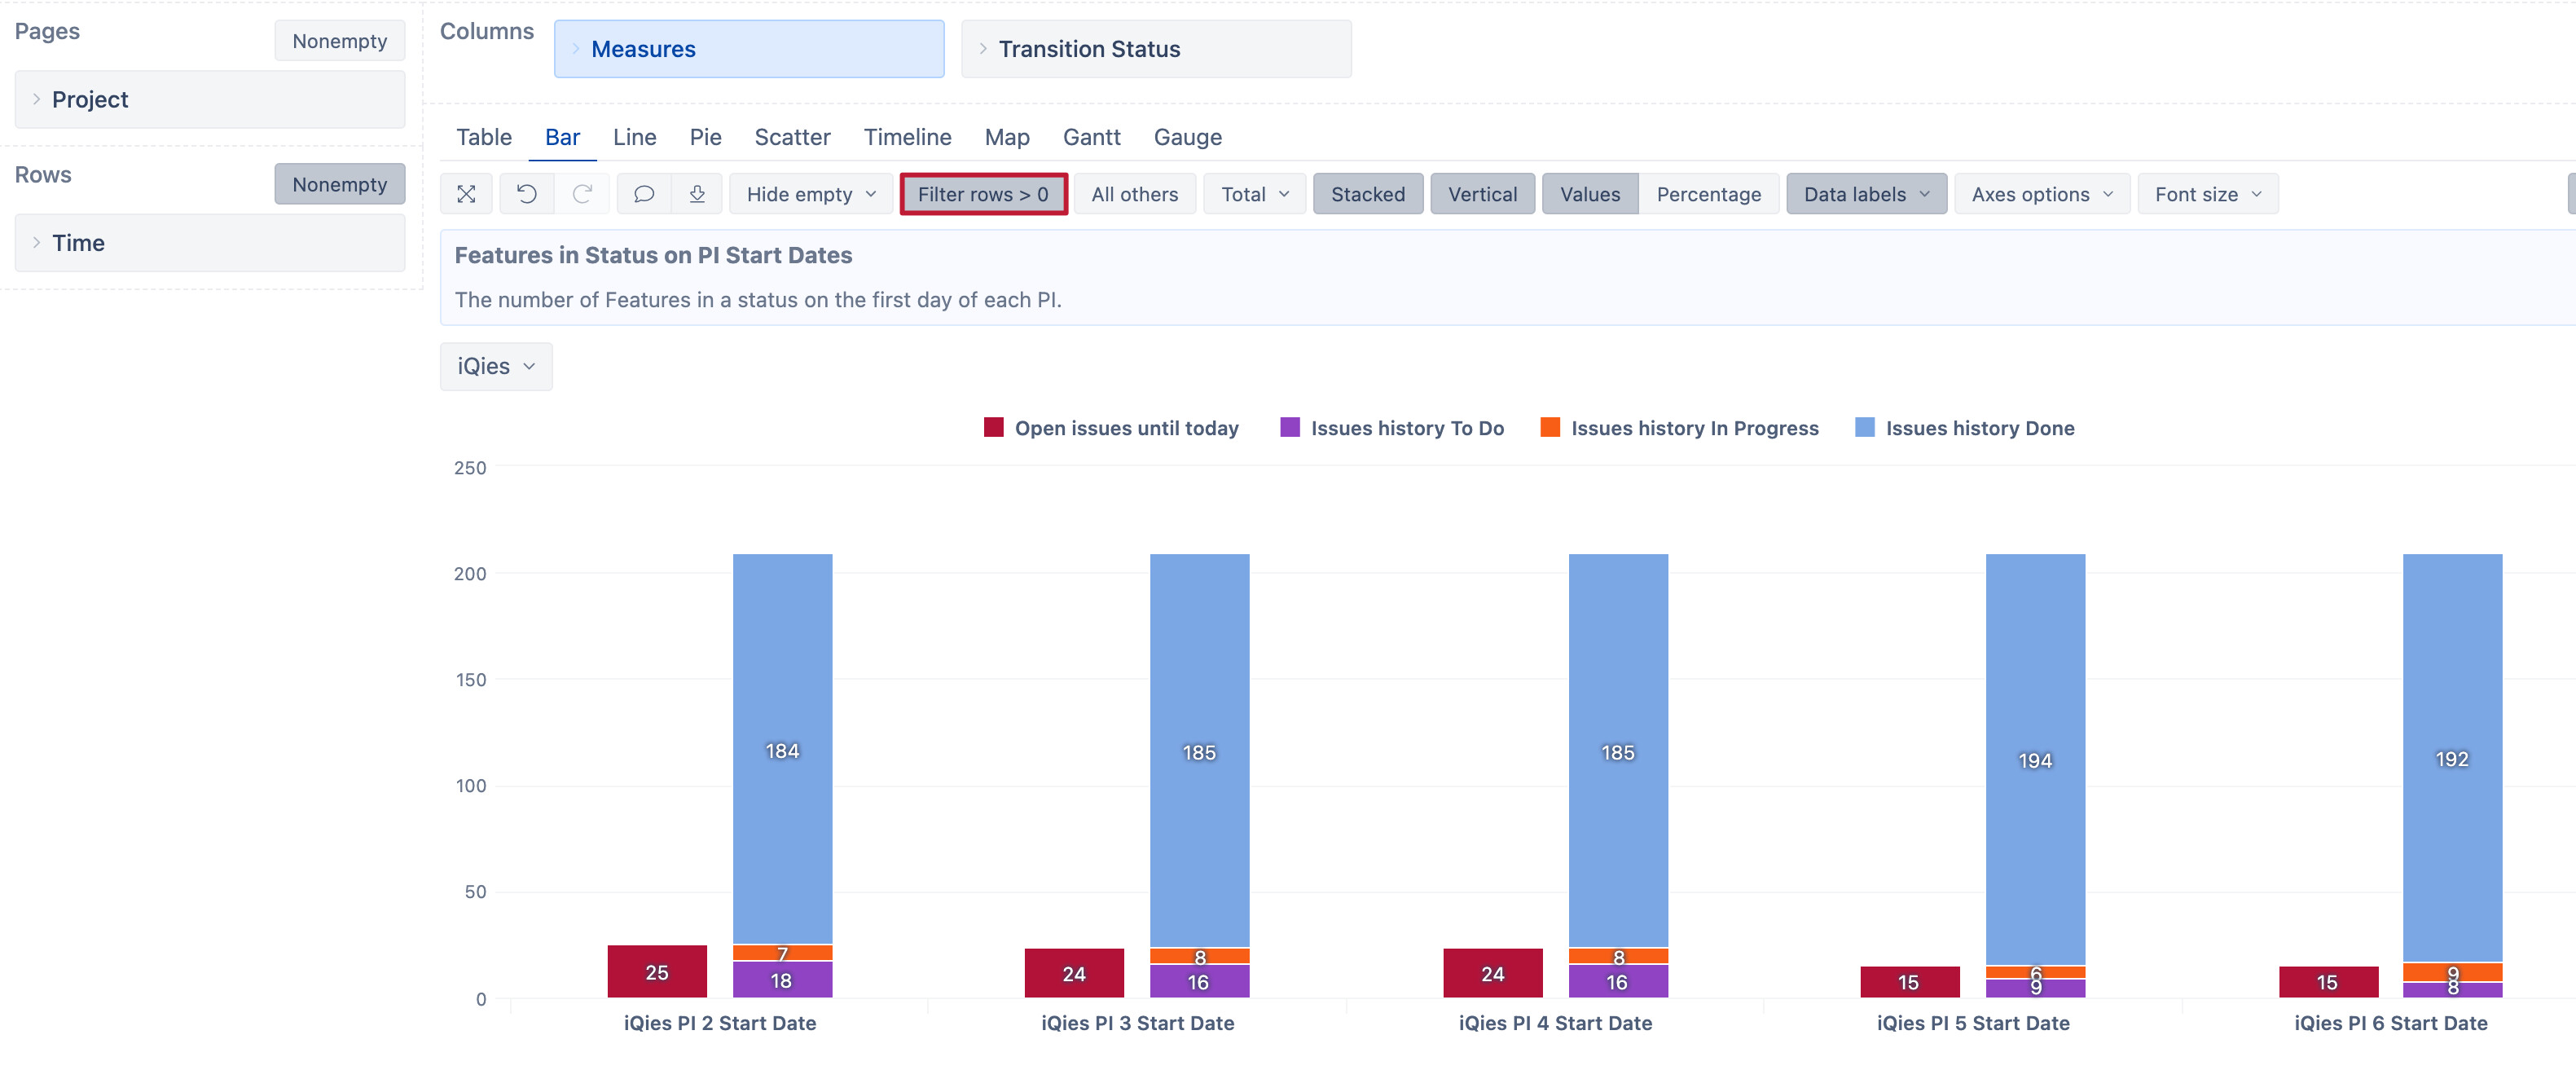
Here is the current report defintion with measures from both project categories selected in the time dimension
{
“cube_name”: “Issues”,
“cube_reports”: [ {
“name”: “3 - Features in Status by PI Start”,
“folder_name”: “program test reports”,
“result_view”: “bar_chart”,
“definition”: {“columns”:{“dimensions”:[{“name”:“Measures”,“selected_set”:[“[Measures].[Open issues until today]”,“[Measures].[Issues history]”],“members”:[]},{“name”:“Transition Status”,“selected_set”:[“[Transition Status].[Funnel]”,“[Transition Status].[Analyzing (SAFe)]”,“[Transition Status].[Refining]”,“[Transition Status].[Ready for PI]”,“[Transition Status].[Feature Definition]”,“[Transition Status].[Feature Refinement]”,“[Transition Status].[Feature Deep Dive]”,“[Transition Status].[PI Ready]”],“members”:[],“bookmarked_members”:[{“depth”:1,“name”:“Implementing”,“full_name”:“[Transition Status].[Implementing]”},{“depth”:1,“name”:“Funnel”,“full_name”:“[Transition Status].[Funnel]”},{“depth”:1,“name”:“Analyzing (SAFe)”,“full_name”:“[Transition Status].[Analyzing (SAFe)]”},{“depth”:1,“name”:“Analyzing”,“full_name”:“[Transition Status].[Analyzing]”},{“depth”:1,“name”:“Refining”,“full_name”:“[Transition Status].[Refining]”},{“depth”:1,“name”:“Ready for PI”,“full_name”:“[Transition Status].[Ready for PI]”},{“depth”:1,“name”:“Ready for Validation”,“full_name”:“[Transition Status].[Ready for Validation]”},{“depth”:1,“name”:“Ready for Release”,“full_name”:“[Transition Status].[Ready for Release]”},{“depth”:1,“name”:“Resolved”,“full_name”:“[Transition Status].[Resolved]”},{“depth”:1,“name”:“PI Ready”,“full_name”:“[Transition Status].[PI Ready]”},{“depth”:1,“name”:“Feature Definition”,“full_name”:“[Transition Status].[Feature Definition]”},{“depth”:1,“name”:“Feature Refinement”,“full_name”:“[Transition Status].[Feature Refinement]”},{“depth”:1,“name”:“Feature Deep Dive”,“full_name”:“[Transition Status].[Feature Deep Dive]”}]}]},“rows”:{“dimensions”:[{“name”:“Time”,“selected_set”:[“[Time].[iQies PI 2 Start Date]”,“[Time].[iQies PI 3 Start Date]”,“[Time].[iQies PI 4 Start Date]”,“[Time].[iQies PI 5 Start Date]”,“[Time].[iQies PI 6 Start Date]”,“[Time].[PI 14 - EQRS]”,“[Time].[PI 15 - EQRS]”,“[Time].[PI 16 - EQRS]”,“[Time].[PI 17 - EQRS]”,“[Time].[PI 18 - EQRS]”],“members”:[],“bookmarked_members”:[]}],“nonempty_crossjoin”:true},“pages”:{“dimensions”:[{“name”:“Project”,“selected_set”:[“[Project.Category].[All Projects by category]”],“members”:[{“depth”:0,“name”:“All Projects by category”,“full_name”:“[Project.Category].[All Projects by category]”,“drillable”:true,“type”:“all”,“expanded”:true,“drilled_into”:false},{“depth”:1,“name”:“iQIES”,“full_name”:“[Project.Category].[iQIES]”,“drillable”:true,“parent_full_name”:“[Project.Category].[All Projects by category]”}],“bookmarked_members”:[{“depth”:1,“name”:" End-Stage Renal Disease Quality Reporting System",“full_name”:“[Project].[ End-Stage Renal Disease Quality Reporting System]”,“drillable”:true,“key”:“EQRS”},{“depth”:1,“name”:“iQIES Program Board “,“full_name”:”[Project].[iQIES Program Board ]”,“drillable”:true,“key”:“IQIESPB”},{“depth”:1,“name”:“iQIES Program Project-NEW”,“full_name”:“[Project].[iQIES Program Project-NEW]”,“drillable”:true,“key”:“IQIESPP”}],“current_page_members”:[“[Project.Category].[iQIES]”]},{“name”:“Issue Type”,“selected_set”:[“[Issue Type].[Epic]”],“members”:[{“depth”:1,“name”:“Epic”,“full_name”:“[Issue Type].[Epic]”}],“bookmarked_members”:[{“depth”:1,“name”:“Epic”,“full_name”:“[Issue Type].[Epic]”}],“current_page_members”:[“[Issue Type].[Epic]”]}]},“options”:{“nonempty”:“columns”},“view”:{“current”:“bar_chart”,“maximized”:false,“bar_chart”:{“stacked”:true,“vertical”:true,“swap_axes”:false,“data_labels”:“values”,“series_options”:{“To Do”:{“color”:“#344563”},“In Progress”:{“color”:“#2F579C”},“Done”:{“color”:“#00875A”},“Funnel”:{“color”:“#274380”},“Refining”:{“color”:“#FFBC29”},“Ready for PI”:{“color”:“#0093B5”},“Implementing”:{“color”:“#34AD70”}}},“table”:{}},“calculated_members”:[],“description”:“\u003cH4\u003e\u003cB\u003eFeatures in Status on PI Start Dates\u003c/H4\u003e\u003c/B\u003e\nThe number of Features in a status on the first day of each PI.”}
} ],
“calculated_members”: [{“dimension”:“Measures”,“name”:“Open issues”,“format_string”:“#,##0”,“formula”:“CASE WHEN [Issue].CurrentMember.Level.Name \u003c\u003e ‘Issue’ THEN\n Cache(\n NonZero(Sum(PreviousPeriods([Time].CurrentHierarchyMember),\n Cache([Measures].[Issues created]\n - [Measures].[Issues resolved])\n ))\n + [Measures].[Issues created]\n - [Measures].[Issues resolved]\n )\nWHEN [Time].CurrentHierarchyMember IS [Time].CurrentHierarchy.DefaultMember\nTHEN NonZero([Measures].[Issues due])\nELSE\n – optimized formula for drill through Issue\n NonZero(IIF(\n DateBeforePeriodEnd(\n [Issue].CurrentMember.get(‘Created at’),\n [Time].CurrentHierarchyMember) AND\n NOT DateBeforePeriodEnd(\n [Issue].CurrentMember.get(‘Resolved at’),\n [Time].CurrentHierarchyMember),\n ([Time].CurrentHierarchy.DefaultMember,\n [Measures].[Issues created]),\n 0\n ))\nEND”},{“dimension”:“Measures”,“name”:“Issues history”,“format_string”:“#,##0”,“formula”:“Cache(\n NonZero(Sum(PreviousPeriods([Time].CurrentHierarchyMember),\n Cache([Measures].[Transitions to]\n - [Measures].[Transitions from])\n ))\n + [Measures].[Transitions to]\n - [Measures].[Transitions from]\n)”},{“name”:“PI 14 - EQRS”,“dimension”:“Time”,“formula”:“[Time].[Day].DateMember(‘Apr 4 2021’)”,“format_string”:“mmm dd yyyy”},{“name”:“PI 15 - EQRS”,“dimension”:“Time”,“formula”:“[Time].[Day].DateMember(‘Jul 20 2021’)”,“format_string”:“mmm dd yyyy”},{“name”:“Open issues until today”,“dimension”:“Measures”,“formula”:“CASE WHEN\n DateCompare(\n [Time].CurrentHierarchyMember.StartDate,\n now()\n ) \u003c 0\nTHEN [Measures].[Open issues]\nEND”,“format_string”:“”},{“name”:“PI 16 - EQRS”,“dimension”:“Time”,“formula”:“[Time].[Day].DateMember(‘Oct 13 2021’)\n”,“format_string”:“”},{“name”:“PI 17 - EQRS”,“dimension”:“Time”,“formula”:“[Time].[Day].DateMember(‘Jan 19 2022’)”,“format_string”:“”},{“name”:“PI 18 - EQRS”,“dimension”:“Time”,“formula”:“[Time].[Day].DateMember(‘Apr 13 2022’)”,“format_string”:“”},{“name”:“iQies PI 2 Start Date”,“dimension”:“Time”,“formula”:“[Time].[Day].DateMember(‘Apr 14 2021’)”,“format_string”:“”},{“name”:“iQies PI 3 Start Date”,“dimension”:“Time”,“formula”:“[Time].[Day].DateMember(‘Jul 7 2021’)”,“format_string”:“”},{“name”:“iQies PI 4 Start Date”,“dimension”:“Time”,“formula”:“[Time].[Day].DateMember(‘Oct 13 2021’)”,“format_string”:“”},{“name”:“iQies PI 5 Start Date”,“dimension”:“Time”,“formula”:“[Time].[Day].DateMember(‘Jan 19 2022’)”,“format_string”:“”},{“name”:“iQies PI 6 Start Date”,“dimension”:“Time”,“formula”:“[Time].[Day].DateMember(‘Apr 20 2022’)”,“format_string”:“”}]
}
The approach I have been taking is probably not the best, so any solution approaches are appreciated