Hello,
I’m currently working on a metric that will allow me to know the amount of issues that raised up by their severity.
The thing is that we are catching that information from a custom field called “Issue SFDC Severity” imported as a property.
I was able to pull the information on each field by now, which gives me something like this:
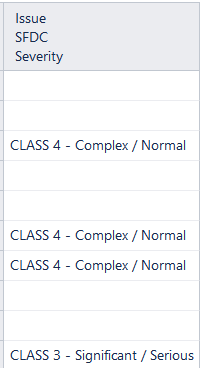
The problem is that I can’t find a way to get a count of each one. I’m aiming for a bar chart that will show me how many issues appeared for each case.
Hopefully I made myself clear.
Thanks!
Lucas
Hi @Lucas_Laroz
Welcome to eazyBI community.
In this case, the best would be selecting and importing your custom field also as separate dimension.
Then you could use this dimension and the predefined measure “Issues created” in report to split results and see the sum of issues created by the particular SDFC Severity value.
Martins / eazyBI support team.
Hi Martins, thanks for reaching out.
I thought about doing that. But on that specific field, I don’t see the possibility to import as a dimension. I only have the ability to import it as a property, which makes things harder.
Lucas
Hi,
Try using advanced settings to define an additional line dimension = true.
That should enable the dimension import for your custom field after advanced settings is updated.
Martins / eazyBI support