Hi team,
I need to create a gantt report on fix versions and with some other dimensions.
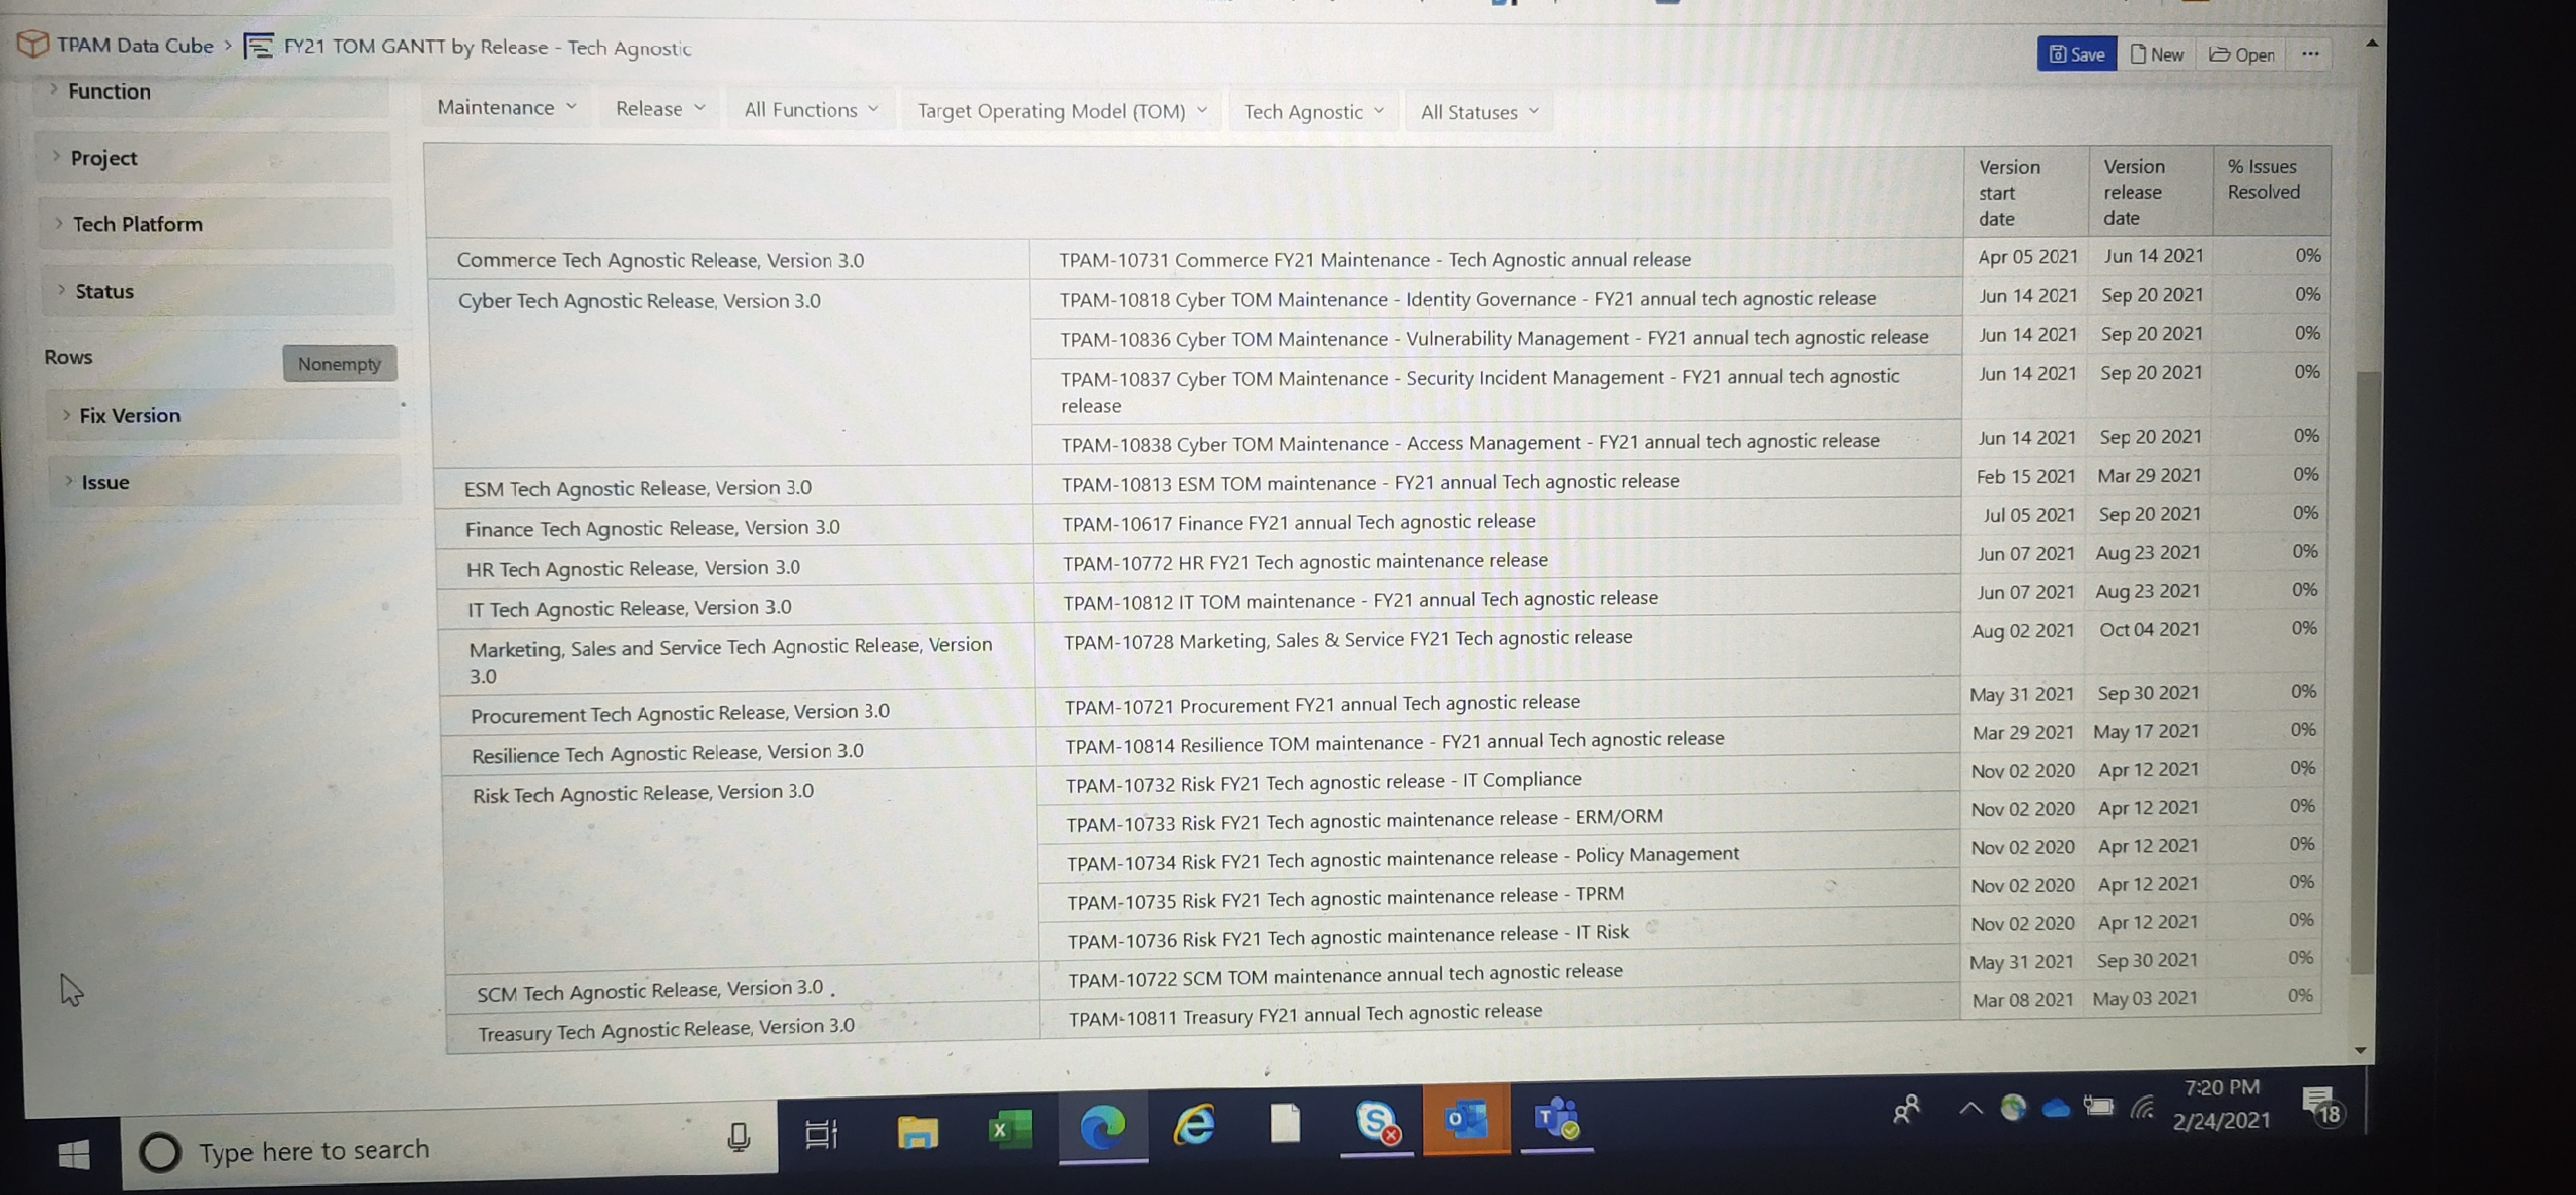
I saw an example on sprints gantt report where sprint points completion % was taken. I’m not sure what to take on case of fix versions.!
IMG_20210224_192005|690x320
Just to add more:
My moto is to get different colors here for progress. Right now, just seeing blue.
Cc: @daina.tupule, @lauma.cirule
Hi @simarpreet_singh ,
I could give you a definitive answer if you shared the formula behind “% Issues Resolved”. I guess it is something similar to the one below:
CASE WHEN [Measures].[Issues created] > 0
THEN
[Measures].[Issues resolved]
/
[Measures].[Issues created]
END
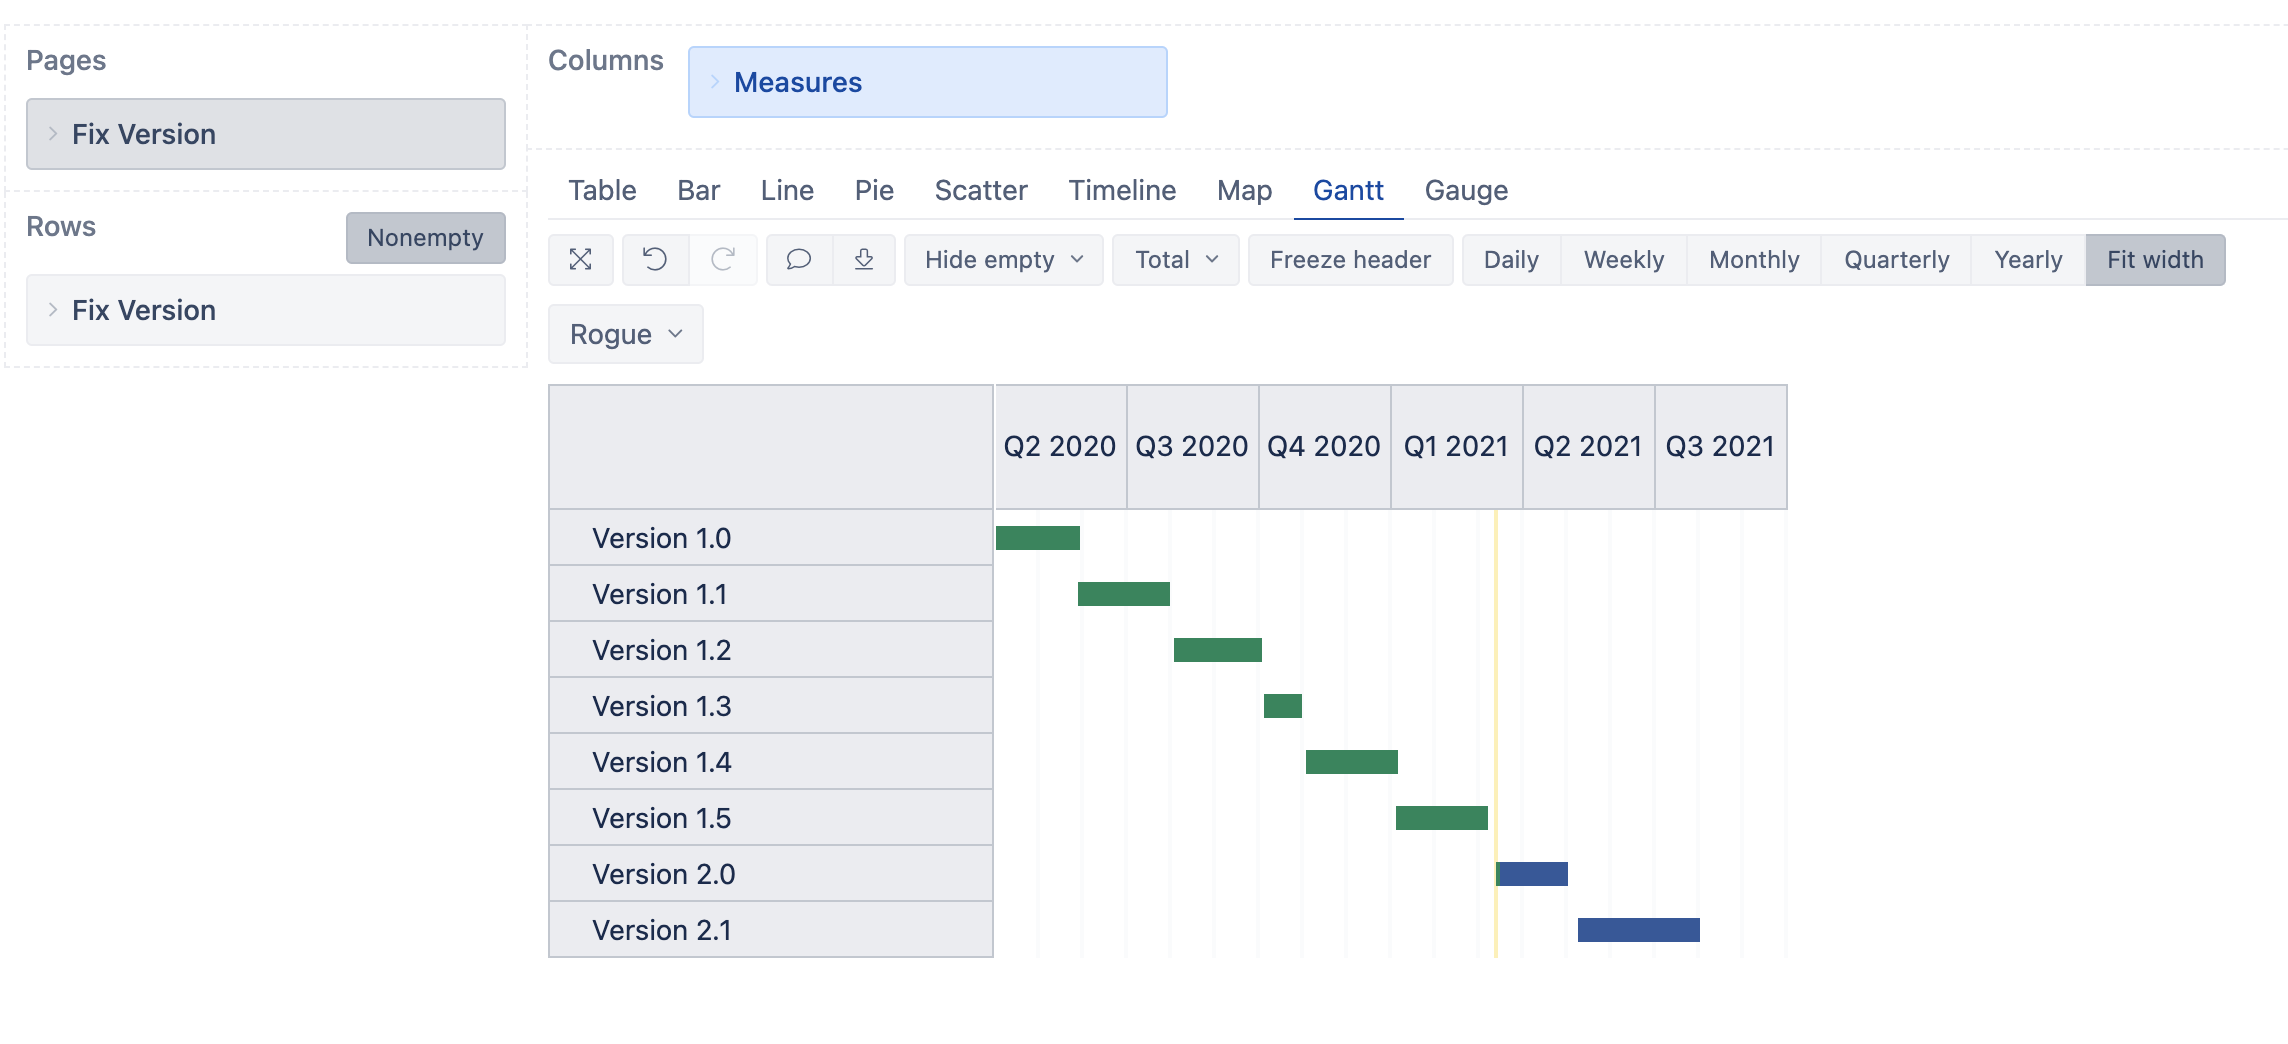
Try removing the Issue dimension from the report, as it doesn’t seem to add any value. After that, the report could take the desired form. Please see a similar report below:
The blue color in the Gantt chart means that the tasks are upcoming. You can see the meaning behind each color here - Create charts - eazyBI for Jira.
Best,
Roberts // support@eazybi.com
