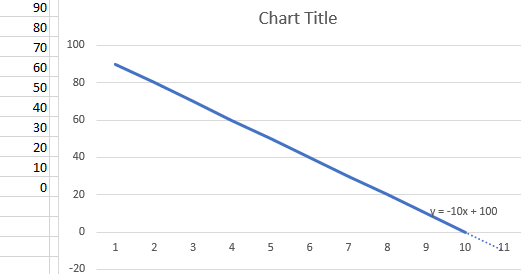
I’m looking to add a declining line representing the ideal trend of test cases per day.
For example, 100 test cases over the next 10 working days, getting to 0 by the end.
y = -10x + 100
I’m looking to add a declining line representing the ideal trend of test cases per day.
For example, 100 test cases over the next 10 working days, getting to 0 by the end.
y = -10x + 100
eazyBI performs a calculation per each row (per each day if you use days on Rows). You would like to reduce the calculation for burndown to y = mx, where
You would apply the filter for what days eazyBI should draw a line as well:
CASE WHEN
-- draw a line on those days:
  DateBetween([Time].CurrentHierarchyMember.StartDate,
    "Today",
    DateAddWorkdays("Today",10)
  )
THEN
-- calculate a pace as total value divided by the number of days to burn it
-- use any measure (or value) representing scope to burn
  (([Measures].[Open issues],
   [Time].CurrentHierarchy.DefaultMember)
   /
-- burn in 10 days
   10 )
   *
-- day's rate in the period
  (
    10 -
    DateDiffWorkdays(
      "Tomorow",
      [Time].CurrentHierarchyMember.NextStartDate
    )
  )
END
I used a measure Open issues for this formula. You can use any other value or measure there. I used this measure in a tuple with Time (it represents total value in this measure for today).
Daina / support@eazybi.com
Hi @daina.tupule,
I’m trying to do something similar, but I would like my line to start “today” and end Nov 1st 2022 on a weekly timeline.
To achieve that, I modified the first part of the query
-- draw a line on those days:
  DateBetween([Time].CurrentHierarchyMember.StartDate,
    "one week ago",
    "Nov 1 2022"
Where I’m having issue is that I would like the line to start at the amount of Open issues I have today and show a decrease of 533 open issues per week.
I tried modifying the formula like this, but I get a burndown of about 285 issues per weeks.
CASE WHEN
-- draw a line on those days:
  DateBetween([Time].CurrentHierarchyMember.StartDate,
    "one week ago",
    "Nov 1 2022"
  )
THEN
-- calculate a pace as total value divided by the number of days to burn it
-- use any measure (or value) representing scope to burn
  (([Measures].[Open issues],
   [Time].CurrentHierarchy.DefaultMember)
   /
-- burn in 10 days
   datediffdays("Today", "Nov 1 2022") )
   *
-- day's rate in the period
  (
    533 -
    DateDiffDays(
      "tomorrow",
      [Time].CurrentHierarchyMember.NextStartDate
    )
  )
END
Do you have an idea of how I could modify this query?
Thanks!
The formula I shared above burns down issues to 0. My comments about “pace” / “days rate” are misleading. They actually show cumulative decreasing days.
Here is a formula example if you would like to burn down a specific pace / specific number of issues per day (it might not lead to 0).
CASE WHEN
-- draw a line on those days:
  DateBetween([Time].CurrentHierarchyMember.StartDate,
    "Today",  "Nov 1 2022"
  )
THEN
-- scope to burn
  ([Measures].[Open issues],
   [Time].CurrentHierarchy.DefaultMember)
   -
   -- cumulative days burning from tomorrow
   (DateDiffdays(
     "Tomorrow", [Time].CurrentHierarchyMember.NextStartDate
    )
   *
   -- set a pace here
  533)
END
I would be cautious on how to use week ago in this burndown. I would suggest starting the line with today and burndown with tomorrow.
Daina / support@eazybi.com
Hi @daina.tupule,
thanks a lot for the query! It works perfectly, I just had to divide my pace by 7 since I have a weekly timeline.
Have a good day,
Marilou
Hi again @daina.tupule,
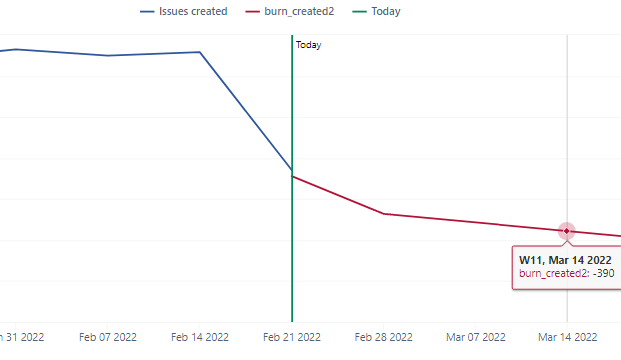
I’m trying to adapt the query to work with Created Issue. It does work, but it starts at the point of cumulative issues created and I would like it to start at (or close to) the amount of issues created so far this week or even last week.
For the line to start at the height of issues created this week, I changed this
-- scope to burn
  ([Measures].[Open issues],
   [Time].CurrentHierarchy.DefaultMember)
to this
-- scope to burn
  ([Measures].[Open issues],
   [Time].CurrentHierarchy.CurrentMember)
Which works, but the slope is more accentuated than is should for the 1st week. Instead of being a slope of 105 per week (15 per day), it’s a slope of 459
I also tried having the line start at the height of the previous week like this:
-- scope to burn
  ([Measures].[Open issues],
   [Time].CurrentHierarchymember.PrevMember)
But then I get 2 weeks with incorrect slope
I also tried to use [Time.Weekly] instead of just [Time] in the query and it doesn’t seem to make any changes.
Here’s is my complete query, in case I modified something else and don’t remember
CASE WHEN
-- draw a line on those days: ("Today" changed for "Yesterday" because the line starts next week otherwise
  DateBetween([Time.Weekly].CurrentHierarchyMember.StartDate,
    "yesterday",  "Nov 1 2022"
  )
THEN
-- scope to burn
  ([Measures].[Issues created],
   [Time.Weekly].CurrentHierarchyMember.PrevMember)
   -
   -- cumulative days burning from tomorrow
   (DateDiffdays(
     "tomorrow", [Time.Weekly].CurrentHierarchyMember.NextStartDate
    )
   *
   -- set a pace here per day (105 per week = 15 per day)
  15)
END
Is this something you could help me with?
Thanks!
Marilou
Measure Issues created works differently than Open issues. Open issues for today will give the same results for tomorrow as well. Therefore, we use Time DefaultMember to show the current value. However, measure Issues created shows values per each particular period. You would like to address this period explicitly. Time CurrentHierarchyMember changes over time representing different periods.
You can use [Time.Weekly].[Week].CurrentDateMember to address this week.
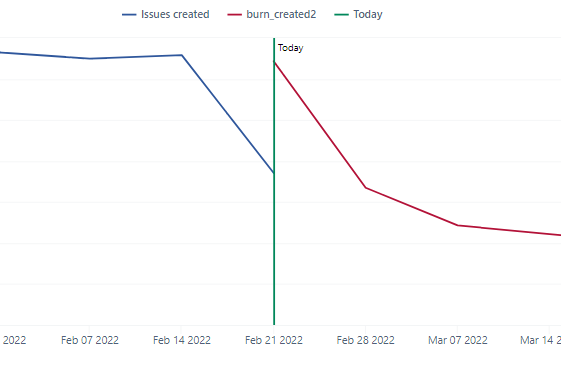
Here is an example formula for burning down issues created in PreviousWeek:
CASE WHEN
--  [Time.Weekly].[Week].CurrentDateMember.StartDate used to start a line this week
  DateBetween(
    [Time.Weekly].CurrentHierarchyMember.StartDate,
    [Time.Weekly].[Week].CurrentDateMember.StartDate,  "Nov 1 2022"
   )
THEN
-- scope to burn
  ([Measures].[Issues created],
   [Time.Weekly].[Week].CurrentDateMember.PrevMember) -- issues created in previous week
   -
   -- cumulative days burning from tomorrow
   (DateDiffdays(
     DateAddDays([Time.Weekly].[Week].CurrentDateMember.StartDate,1), -- burn down from a beginning of this week
     [Time.Weekly].CurrentHierarchyMember.NextStartDate
    )
   *
   -- set a pace here per day (105 per week = 15 per day)
  15)
WHEN
-- show the value of created issues in the previous week for burndown as well:
DateInPeriod(
  [Time.Weekly].[Week].CurrentDateMember.PrevMember.StartDate, [Time].CurrentHierarchyMember
)
THEN Val([Measures].[Issues created])
END
Daina / support@eazybi.com