@martins.vanags yes you are right it did change during 6 month
how can I resolve this issue so that it calculate correctly if something changes during . Date range
@martins.vanags yes you are right it did change during 6 month
how can I resolve this issue so that it calculate correctly if something changes during . Date range
Does it mean you want to calculate the historical results based on the current issue type?
If that is the case, you could try using advanced settings to define a new calcualted field, “Current issue type” which would import the current issue type for each issue.
[jira.customfield_curit]
name = "Current issuetype"
data_type = "string"
dimension = true
javascript_code = '''
if(issue.fields.issuetype){
    issue.fields.customfield_curit= issue.fields.issuetype.name
  }
'''
Then select this new field “Current issue type” for import as a dimension from the import options page.
And use this dimension instead of original “issue type” dimension to filter the report.
Martins / eazyBI
Thank you @martins.vanags for yout help
Hello @martins.vanags
Thanks for the formula and the support.
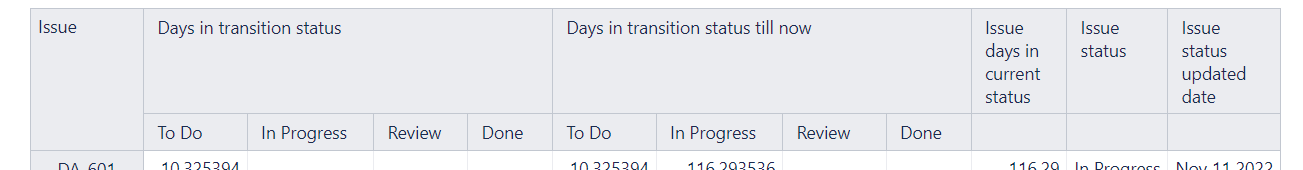
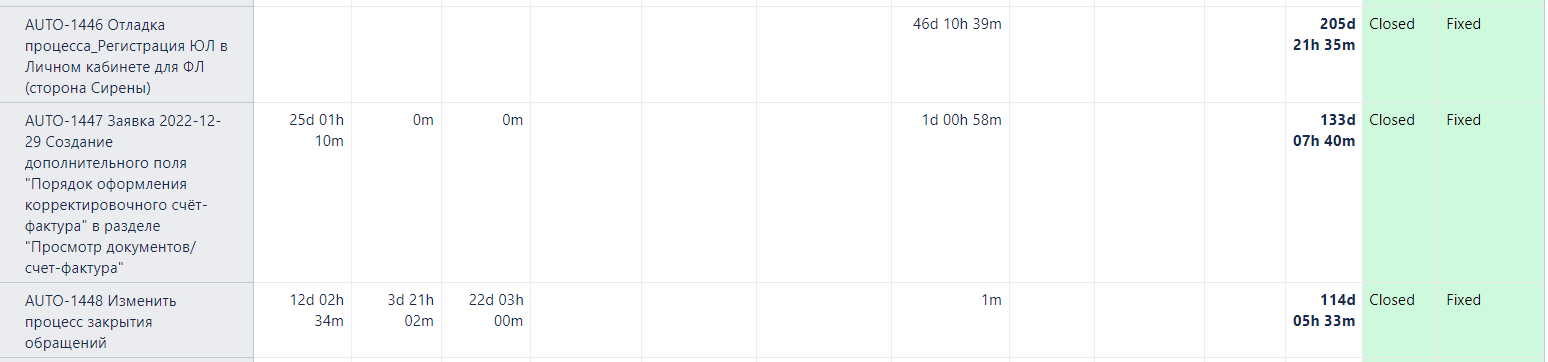
The formula gives the number of days issues are in a given status
How can we get the days issues are in?
e.g.
ISSUE-A is 2 days (20th nov 2022, 21th nov 2022) in status NEW.
How can we list (20th nov 2022, 21th nov 2022)?
Best regards
@Bodi
Hello @martins.vanags ,
I will have another request, the formula gives all days for an issue in a given status.
Let’s say, you have some issues that have been in the following status
Creation of issues, then
a) New → 3 days
b) Open → 2 days
c) Pending → 3 days
d) New → 2 days
e) In review → 3 days
The formula will give issues in status New and with a total of 5 days
How can we get issues that have been in status a) New for 3 days only ?
Best regards
@Bodi
@Bodi
If both transitions happened in different periods, you could filter the report by “Time” dimension.
Time will filter report by “transition from” status.
If a) happened in May 2022 and d) happened in Jun 2022, by filtering the report by May 2022 should give you time in status 3 days.
if that didn’t help, please share more details on your use-case - how will you filter the report (what is layout and which dimensions used in report) and what is the business case for it?
Martins /eazyBI
Hello @martins.vanags ,
thanks for the support.
Hi @Marcin
Here you need to step back and temporarily remove the “Transition Status” dimension from the report.
Then use “Drill into” feature (and select “Transition Status” dimension again) from the measure you would like to split by Transition Status dimension members.
And then repeat the step for the next measure.
Martins / eazyBI
@martins.vanags ,
How I can remove Transition status heading from other columns like Issues current status, Issue status update Issue days in current status… I am getting repeated transition status row for each column
Please find how to drill into measure by another dimension:
https://docs.eazybi.com/eazybi/analyze-and-visualize/create-reports#Createreports-Drillintomeasurebyanotherdimensionlevel
In your case, you would need to remove the “Transition Status” dimension from the report first and then use this feature on the “Days in transition status” measure.
Martins / eazyBI support
Thank you so much @martins.vanags ,
Appreciated… Just one more how can we get the Avg as Total at the bottom for custom fields. highlighted one is not showing Avg for the custom fields but second from right it was showing Avg value for all the rows when I selected Total from Top
Thanks for the detailed explanations in this thread.
Is there a way to get a similar measure “Days in transition status till now” on object transition status from Jira Assets?
Especially for assets, which stay for a longer period in their current status, this would be an even more relevant metric then the “Days in transition status” without taking the time in the current status into account.
Looking forward to a hopefully positive response,
Patrick
Hi Martin,
I’m using the “Days in transition status” measure and is experiencing the same repeated columns. I’m cannot follow the instructions about drilling in. Can you provide more detailed explanation? Sorry, I am a new easyBI user.
Hey @KeithatFT
Please check this documentation page on how to interact with eazyBI reports:
https://docs.eazybi.com/eazybi/analyze-and-visualize/create-reports/interact-with-report
I believe you are asking about the “Drill into” feautre from the measure, but then you have to remove the secondary dimension from the report before you use the “drill into” feature for the measure.
Martins / eazyBI
Hi!
Your code for counting time in past and current statuses was very helpful to me. I would like to correct one thing. How to exclude the Closed status from the count?
The code counts all the days when the task is in the closed state. How should the code look in this case?
Please help.
Could something similar be created to give me the amount of time in a state today, but that differs depending on whether the incident has previously passed through that state or not? That is, it would show me the time spent in a specific state.
@emiliano.sant
Try creating new user-defined calcualted measure using this formula
-- days in transition status when issue was in this status in previous times
IIF(
  -- if report uses Status dimension instead of Transition status it should work as well:
  [Status].CurrentHierarchyMember.Level.Name = "Status" and Not [Transition Status].CurrentHierarchyMember.Level.name = "Transition Status",
    ([Measures].[Days in transition status],
     [Transition Status].[Transition status].GetMemberByKey(
        [Status].CurrentHierarchyMember.Key
    )),
    [Measures].[Days in transition status])
+
-- days since last transition to this status
NonZero(SUM(Filter(
  Descendants([Issue].CurrentMember, [Issue].[Issue]),
  -- for unresovled issues only
  IsEmpty([Issue].CurrentHierarchyMember.Get("Resolved at"))
  AND
  IIF([Transition status].CurrentHierarchyMember.Level.Name = "Transition Status",
      [Transition status].CurrentHierarchyMember.Name = [Measures].[Issue status], 1)
  AND
  IIF([Status].CurrentHierarchyMember.Level.Name = "Status",
    [Status].CurrentHierarchyMember.Name = [Measures].[Issue status], 1)
  ),
  CASE WHEN
  [Measures].[Issues history] > 0
  THEN
  DateDiffDays(
    [Measures].[Issue status updated date],
    Now()
  )
  END
))
It should calculate the days in historical status + time in current status until the moment you run the report.
Martins / eazyBI
thanks!!! This is the formula I use, but it’s not showing me all the issues. For example, I have bugs in a certain state since February, and it only shows some, not all of them. What I need is the number of days the bugs are in a specific state by assigned person. Just the ones they’re currently in. I have the assignment filters in place. I only need the formula, but it wouldn’t show me all the issues when I check it with Jira.
@emiliano.sant
Please contact support@eazybi.com and share your report definition.
Likely there is more on the report that limits the calculation.
Martins /eazyBI