Total number of defects leaked/Customer Found and Total number of Bugs reported in a pie chart.
Please help me on the calculative measures
Total number of defects leaked/Customer Found and Total number of Bugs reported in a pie chart.
Please help me on the calculative measures
Hi @Sarika,
The way to create the pie chart will depend on how your project is setup in eazyBI and in Jira.
For the total number of bugs, this should be the Issues Created measure (selected by default when you create a new report)
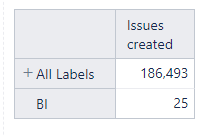
For the Found by Customers issues, it depends how you identify them in Jira. If you identify them with a label for example, you could add the Label dimension in Row , use the ‘‘Search and Bookmark’’ feature to bookmark the correct label. Select this Label and keep All Labels selected. Your table should look something like this:
You can now select the Pie chart view and adjust legends and others as you wish.
Have a good day,
Marilou
Hi @Sarika,
Welcome to the eazyBI community!
The default view for a new report is the table view. You may create the basic report calculations and calculate the figures you want to be displayed.
Marilou marked correctly that the actual calculations depend on your Jira setup.
You need at least one dimension on report rows.
Depending on available dimensions, you may use these dimensions on the page filters to narrow down the dataset to the few categories you want to display on the chart.
Please read here about page filter usage - Create reports.
Depending on setup - you might use the standard measure - ‘Issues created’.
Another option is creating calculated measures to retrieve the figures you need.
Please read more about calculated measures and members here - Calculated measures and members.
You may also create calculated members on another dimension that would constitute the options you want to display on the chart.
Once you have the correct numbers - you may change the chart type to the pie chart.
Please see here how to switch to the pie chart - Create charts.
The option ‘Defects Leaked/Customer found’ does not look like a standard option in Jira. If you still need assistance with the report, please write to the support e-mail a request for assistance with a description of how you define the specific categories for the report.
Kind regards,
Oskars / support@eazyBI.com