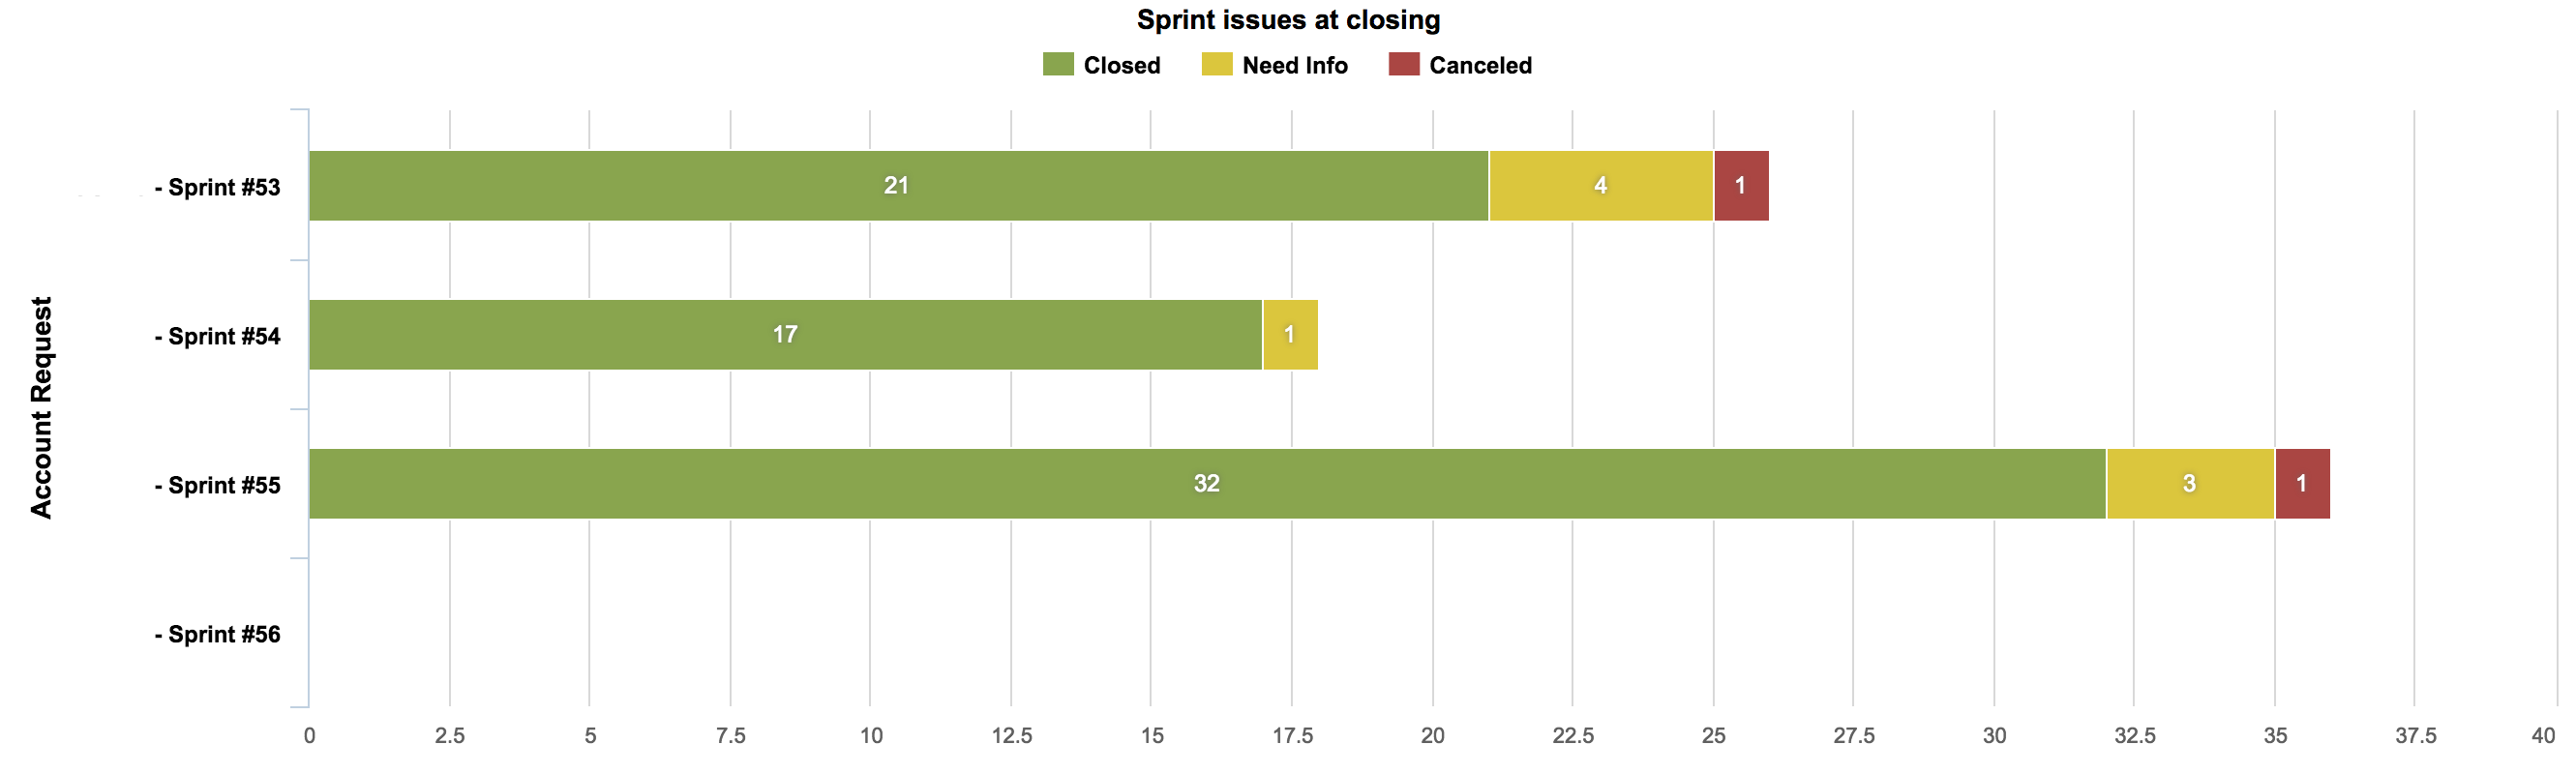
Our organization processes NDAs for incoming developers. These NDA tickets are sometimes cancelled if the request is not granted, or delayed while waiting for additional information. I have been tasked with creating a chart to visualize these NDA status statistics for both closed sprints and the current, open sprint.
I have successfully graphed the closed sprints using the “Status” dimension. However, as the title indicates, the graph is only considering the status at sprint close. Since the current sprint has not yet closed, it shows no issues.
I need to graph the statuses of NDA requests in the open sprint as well. In the graph below, there should be three tickets in “Need Info” status for sprint #56.
How can I do this?