I am trying to build a simple chart to show issue count by project lead. Chart will be a vertical bar with project leads on the X and issue count on the Y. I am using the Project dimension in Rows, but cannot figure out how to report on Project lead instead of Project name.
Hi,
“Project lead” is not a default dimension which would make this much easier.
However, there is one workaround perhaps you can try.
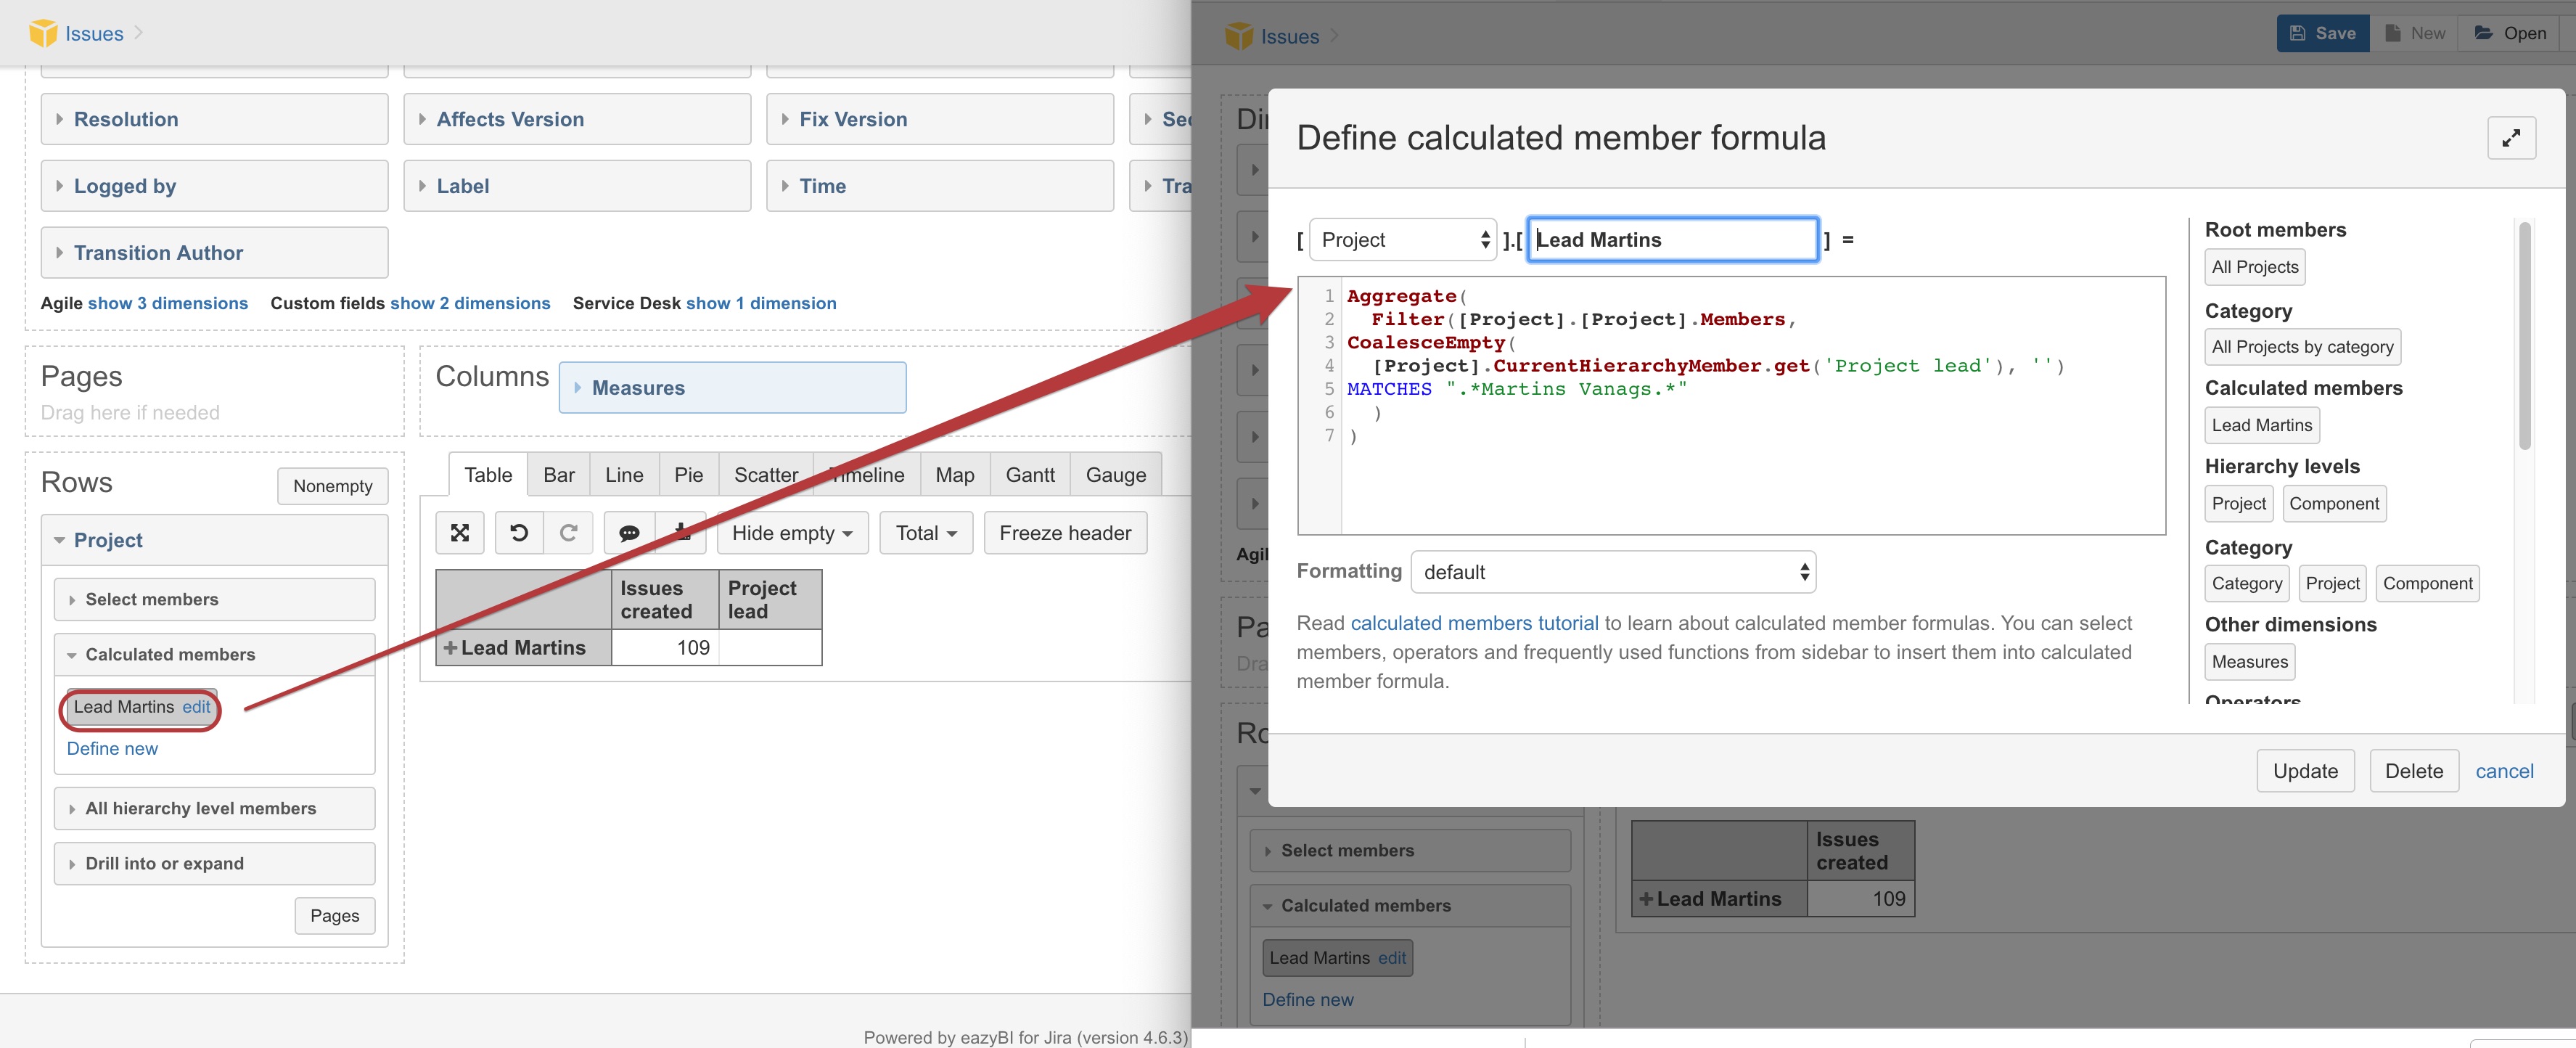
Try creating new calculated members in “Project” dimension that would aggregate projects with the same project lead:
Aggregate(
Filter([Project].[Project].Members,
CoalesceEmpty(
[Project].CurrentHierarchyMember.get(‘Project lead’), ‘’)
MATCHES “.UserDisplayname1.”
)
)
see picture below:
Another alternative would be using Jira misc calculated custom fields to create a new calculated dimension and then import it in eazyBI. See more details here: https://docs.eazybi.com/display/EAZYBIJIRA/Jira+Misc+Custom+Fields#JiraMiscCustomFields-Projectlead
Martins / eazyBI support
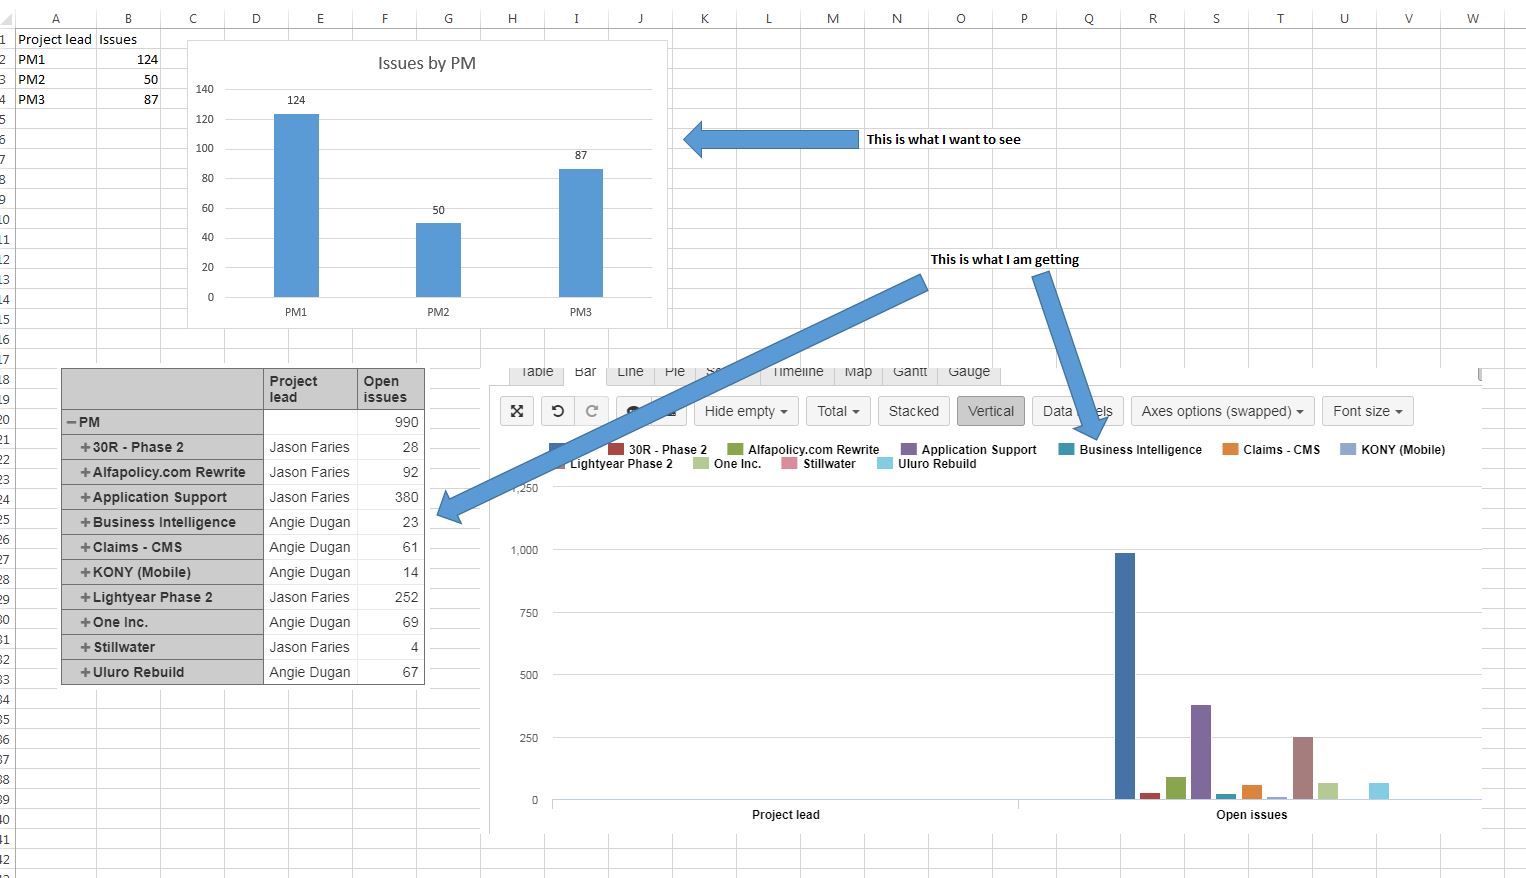
Thank you, the code worked, but not as I expected.
I am trying to create a bar chart showing the total number of issues assigned to each Project lead. I am still ending up with a list of project names in the table header instead of the project leads. The attached image is the result that I want to get, along with an example of what I am trying to create.
Hi,
Where can we see that you have created a separate calculated member for each Project Lead in “Project” dimension? (see the attachment in my previous post).
In your screenshot I see that you still use “Project” dimension members in rows (but not calculated members for each Project Lead).
In that case, you would not need to display each project as separate rows but only one row for each Project lead.
Martins / eazyBI support
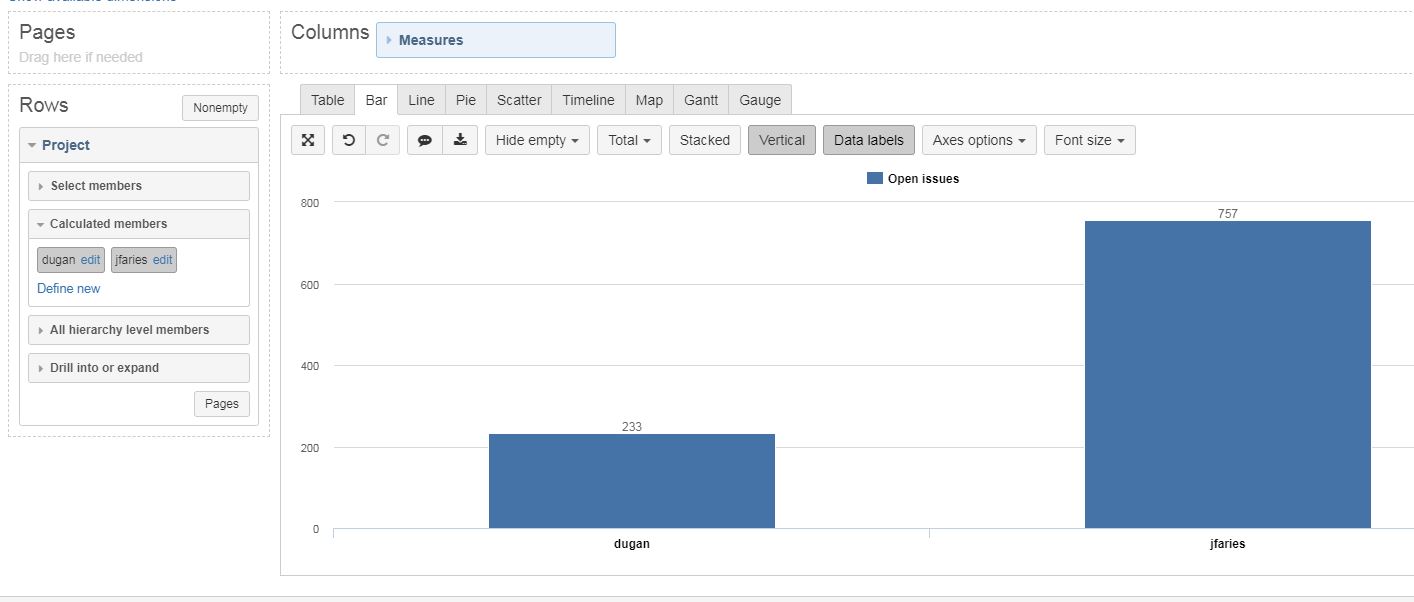
I was using a wildcard in the calculated member instead of building one for each project lead. I have corrected that and I am now getting the names and issues count as expected. Thank you.
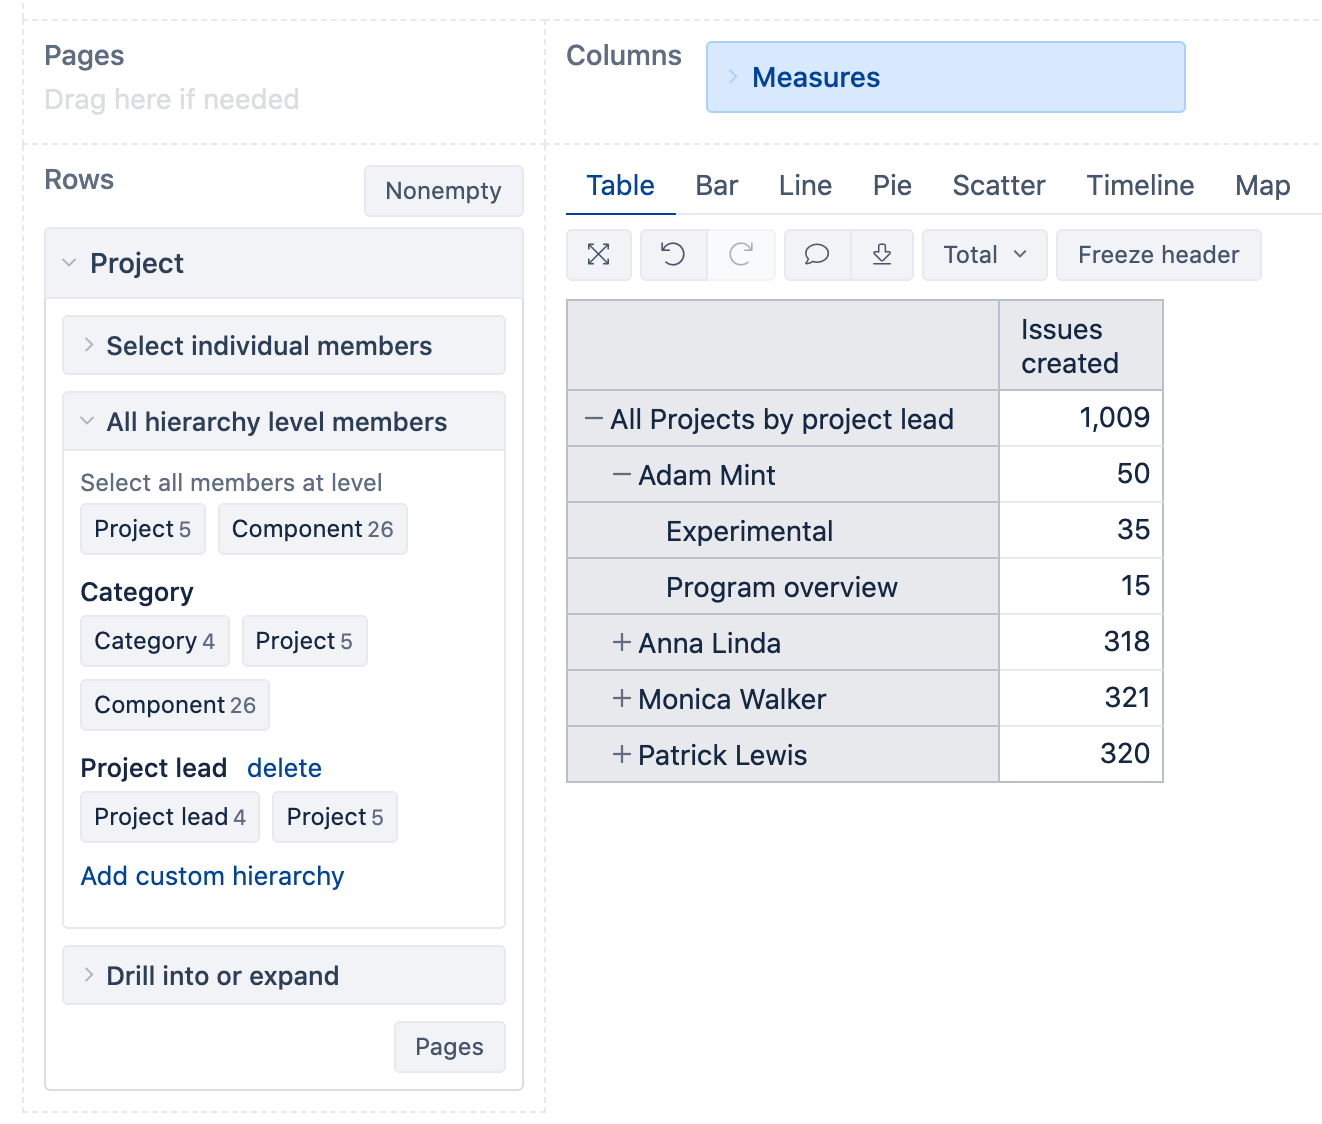
With the version 6.1. we added option to build custom hierarchy in project dimension. You can add the custom hierarchy and use default project property Project lead as a grouping level in the hierarchy. With this option eazyBI will group all projects by project Leads with no additional calcultions needed. This approach will improve the maintenance and the performance of the report as well.
Daina / support@eazybi.com