I’m am trying to create a report showing the number of issues with a specific value in a Jira custom field as a trend over time. The custom field data (named “Score”) has been imported as a measure and property and is an integer.
Here’s what I’m trying to achieve:
filter number of Jira issues with a “score” value >= 100
sum for each month
create trend line to see if number of issues is increasing/decreasing monthly, over time
After watching several videos and reading the community Q&A section, I’m still having a difficult time figuring out how to make this work. Any help you can provide would be greatly appreciated.
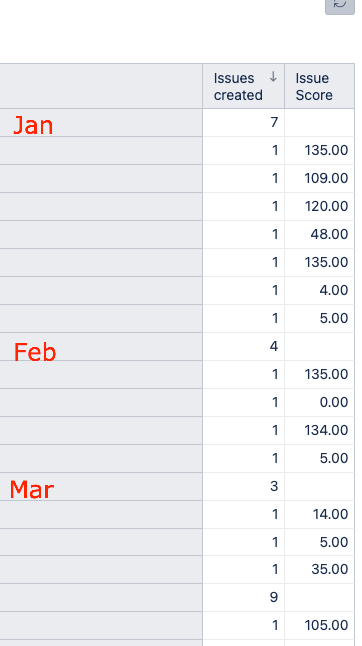
I have the issues grouped by month with columns “Issues created” and “Issue Score”. I’d like to create a column where we are getting the total number of issues with “issue score” >= 100 each month
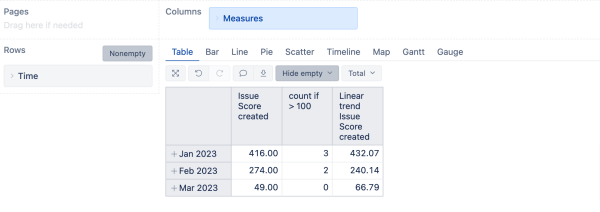
I am not sure what you have selected in Rows, but as a possible solution, you could do the following steps :
1) To count the issues with score value > 0, please define a new calculated measure with the following formula:
2) Add Time dimension in Rows and select Month level
3) Select measure “Score created”
These two steps (nr 2 and 3) will already create a monthly sum of Issue score. Please clarify if you would like to sum all score values or only the ones that are above value “100”? In the scenario I am giving, this will sum all values, even if below 100
4) To add a trendline, left-click on the measure name “Score created” → “Add calculated” → Linear trend.
Your report could look similarly to what I have created below