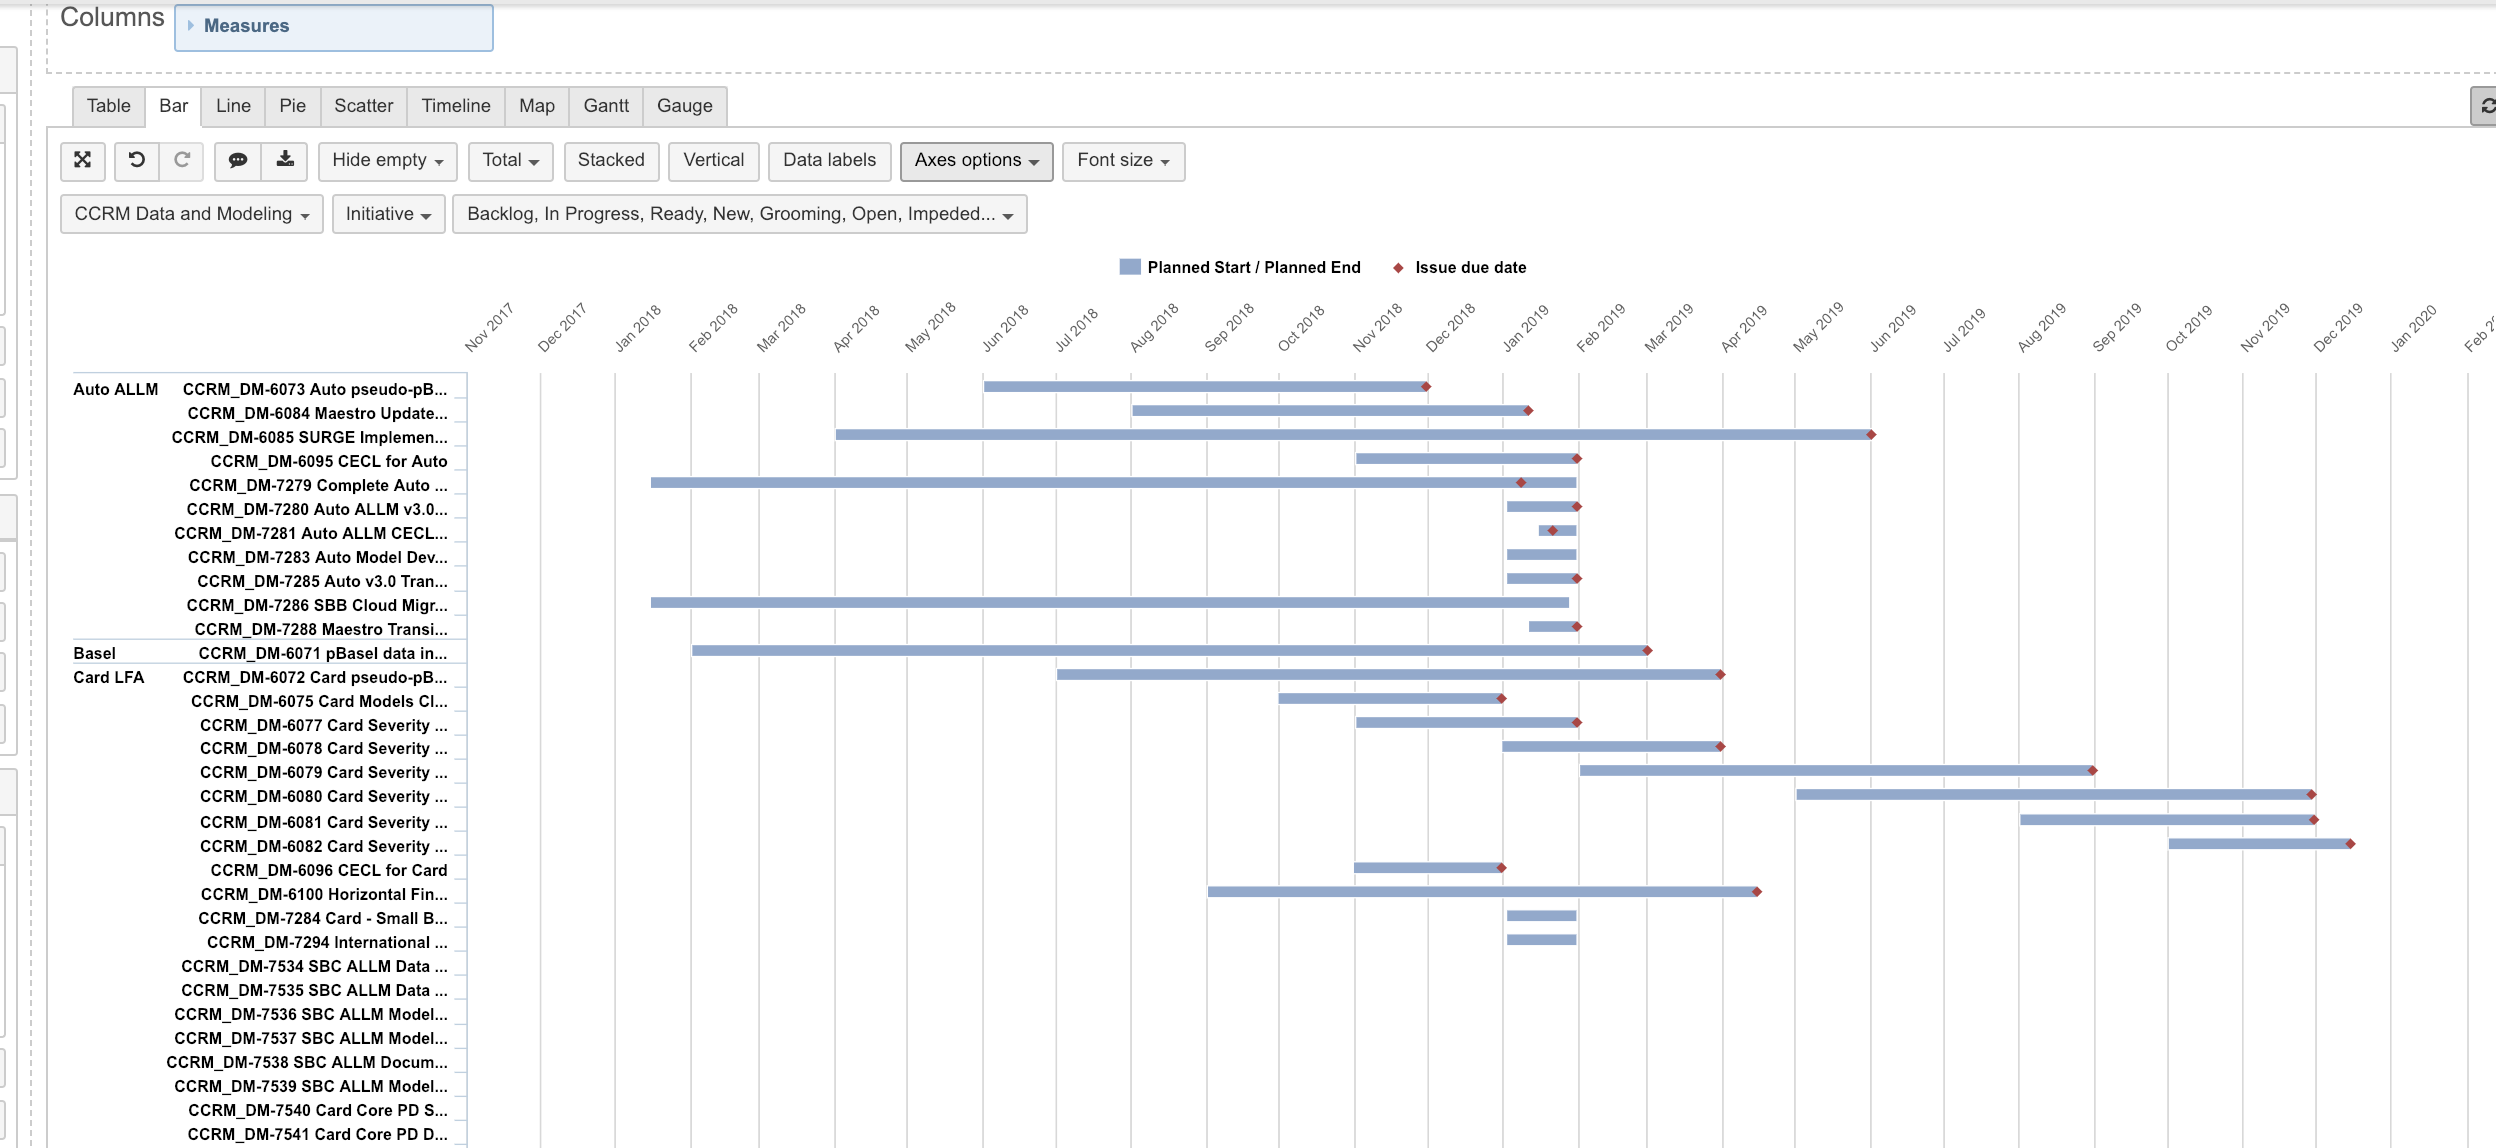
While I would like to pull in all active initiatives in the roadmap below (built on a bar chart for formatting reasons), I would like to adjust the view to show only the next quarter or something.
The problem is that using the Min, Max on the Horizontal Axis options doesn’t seem to work with any Date format I have tried (Min: Dec 2018, 12/01/18, 01/Dec/18, etc.). To be clear I do not want to simply filter for initiatives in this range, but pull in all of them, and then “zoom” the view to see what I want.
IS that possible?
Hi,
When datetime values are on chart axis, dates are treated as numeric values, therefore, dates can’t be used as min/max /step values. For some chart types (e.g. scatter chart) you may convert min and max dates to timestamps (using some convertor in web), then add those timestamps as min/max values. For Bar charts with range type, this approach does not work, unfortunately.
We have an improvement ticket added to the product backlog to allow defining min/max with dates (no ETA yet for this improvement).
Ilze, support@eazybi.com
Hi,
since i could not find any other tickets regarding this topic - are there any news about this like an ETA or some idea for a workaround? 
Best regards,
Maximilian