We wil be making a report based on the data provided right. For example we created a lead time chart of past 6 months report. We will be getting data related to the tickets of the past 6 months right. In the reports also we will be getting with the ticket number and ticket in transition status. What i want is instead of ticket number i want customer request type and product area in the graph. Please let me know if its possible or not.
eazyBI supports importing Jira Service Management (JSM) field Customer request type by default. You can add it to any report if needed. See our demo account for JSM for some report examples. While we do not have reports for Customer request type, it could be added to most reports.
eazyBI allows two ways on how to add some slicing in data:
- use dimension to rows/columns and it will slice data based on the dimension values
- use measures to show different metrics for the issue, you can use custom measures to represent a specific subset of data.
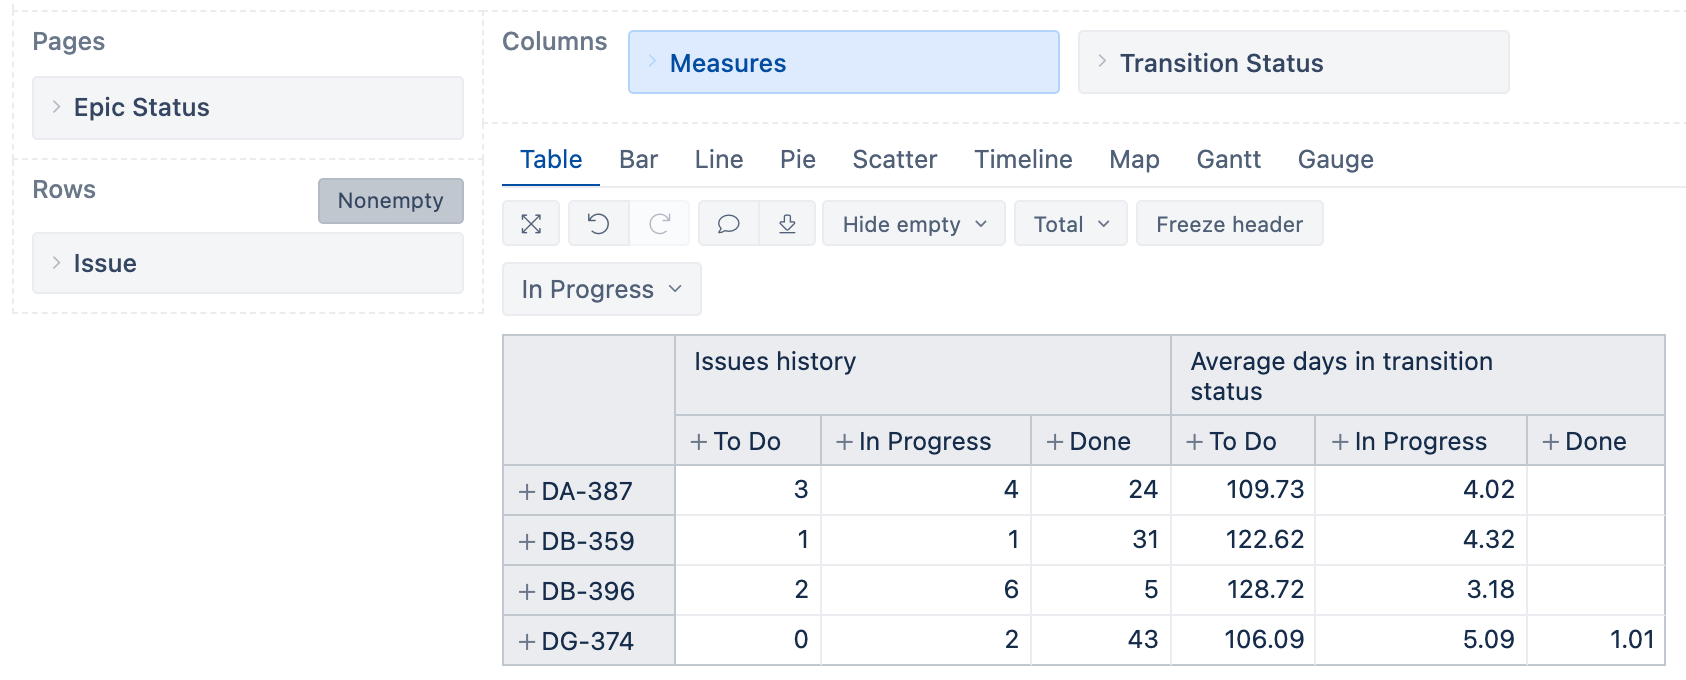
Here is the simplest way on adding an additional dimension to the report. Here I added a dimension Transition status to the report on Columns. It will split any measure in the report. My report contains measures Issues history and Average days in transition status. The dimension Transition status will split them both.
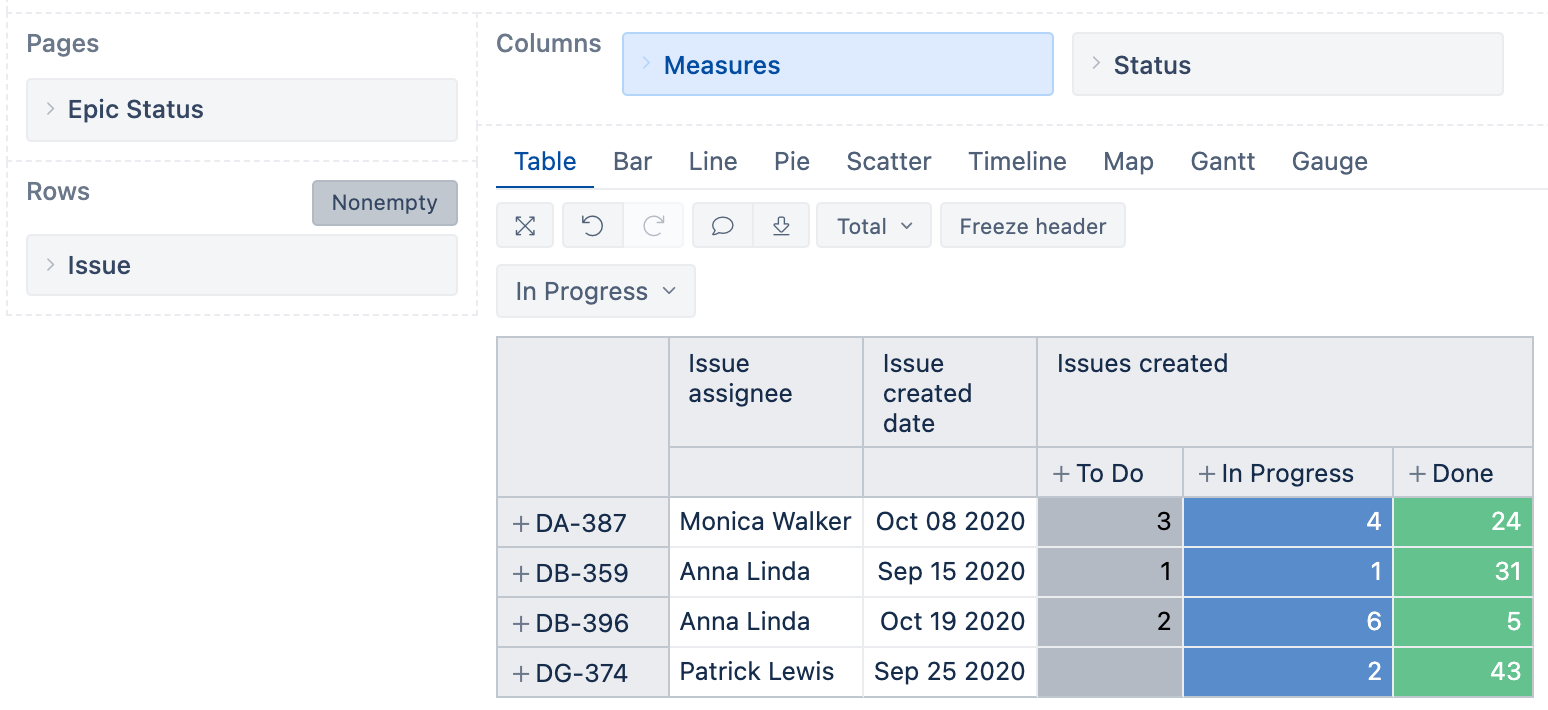
If needed you need data for several measures and would like to slice data for only one measure, you can use drill into dimension option for this particular measure only. Here I used several measures and properties in the report. I would like to slice data only for one of them - Issues created by Status to show current progress for each epic.
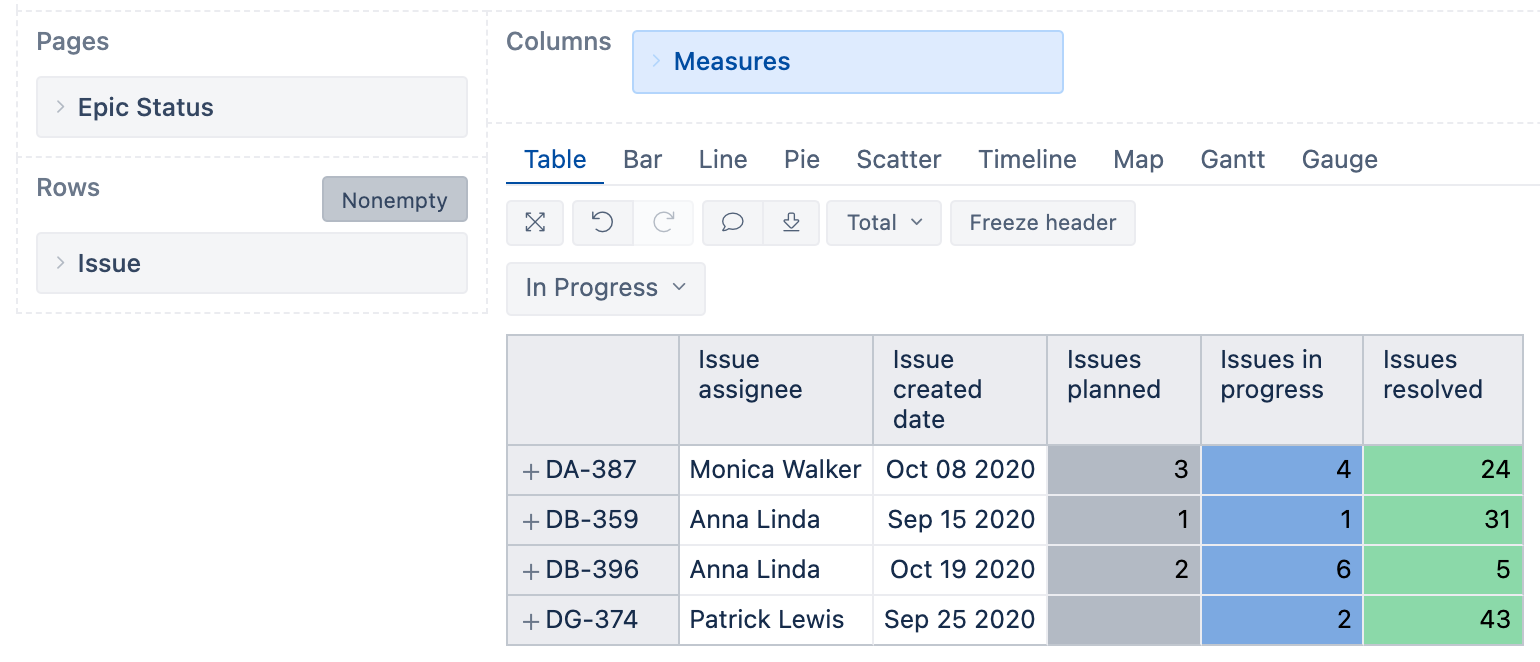
Here is used the option by using measures to show different data. I built measures un using a formula to represent a particular slice of data. Here I used tuples with measure Issues created and Status category To Do for issues planned, and a tuple with measure Issues created and status category In Progress to show the same results as the previous example with drill into the option.
While you can add many dimensions to rows and columns we suggest keeping it as simple as possible. Reports with fewer data will be easier to read and will work faster. You can combine several reports into one dashboard to get a better overview instead of using all the data within one report.
Daina / support@eazybi.com