Need total issues created during Fix Version period

I was able to create this Jira report shown in the image below below. ‘Release’ is same as Fix Version.

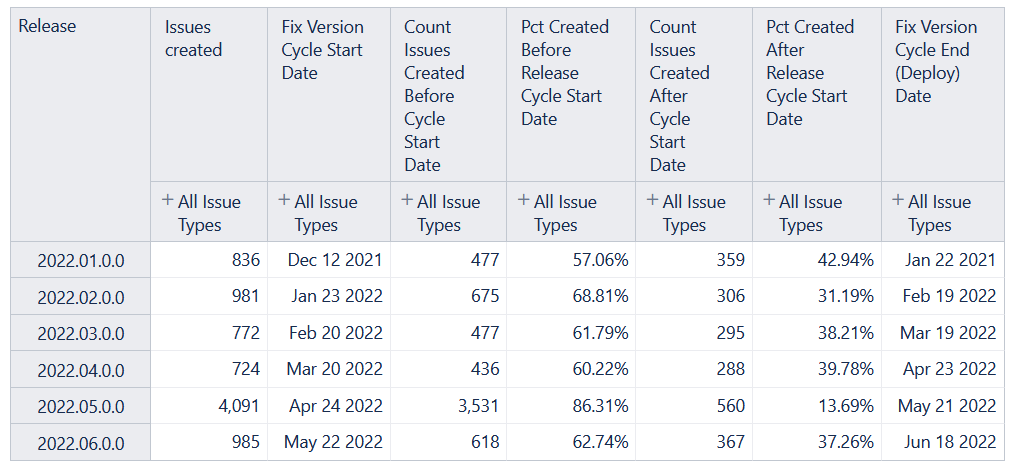
The Fix Version Cycle begins with the day after the previous Fix Version was deployed and extends to the date that the current Fix Version was deployed into production. So for Fix Version 2022.01.0.0 (row 1), the release cycle started on Dec 12 2021 (the day after the previous Fix Version was deployed) and went through Jan 22 2022 (the day that Fix Version 2022.01.0.0 was deployed). Therefore, the Fix Version cycle for 2022.01.0.0 is from Dec 12 2021 thru Jan 22 2022.

This report tells us how many issues were created before the start date of the Fix Version cycle and how many were created during the Fix version cycle and also gives the percents. This data is contained in the following measures:

Count Issues Created Before Cycle Start Date:
NonZero(
Sum(
PreviousPeriods([Time].[Day].DateMember(
[Measures].[Fix version cycle start date])),
[Measures].[Issues created]))

Pct Created Before Release Cycle Start Date:
[Measures].[Count Issues Created Before Cycle Start Date] /
[Measures].[Issues created]

Count Issues Created After Cycle Start Date:
[Measures].[Issues created] -
[Measures].[Count Issues Created Before Cycle Start Date]

Pct Created After Release Cycle Start Date:
[Measures].[Count Issues Created After Cycle Start Date] /
[Measures].[Issues created]

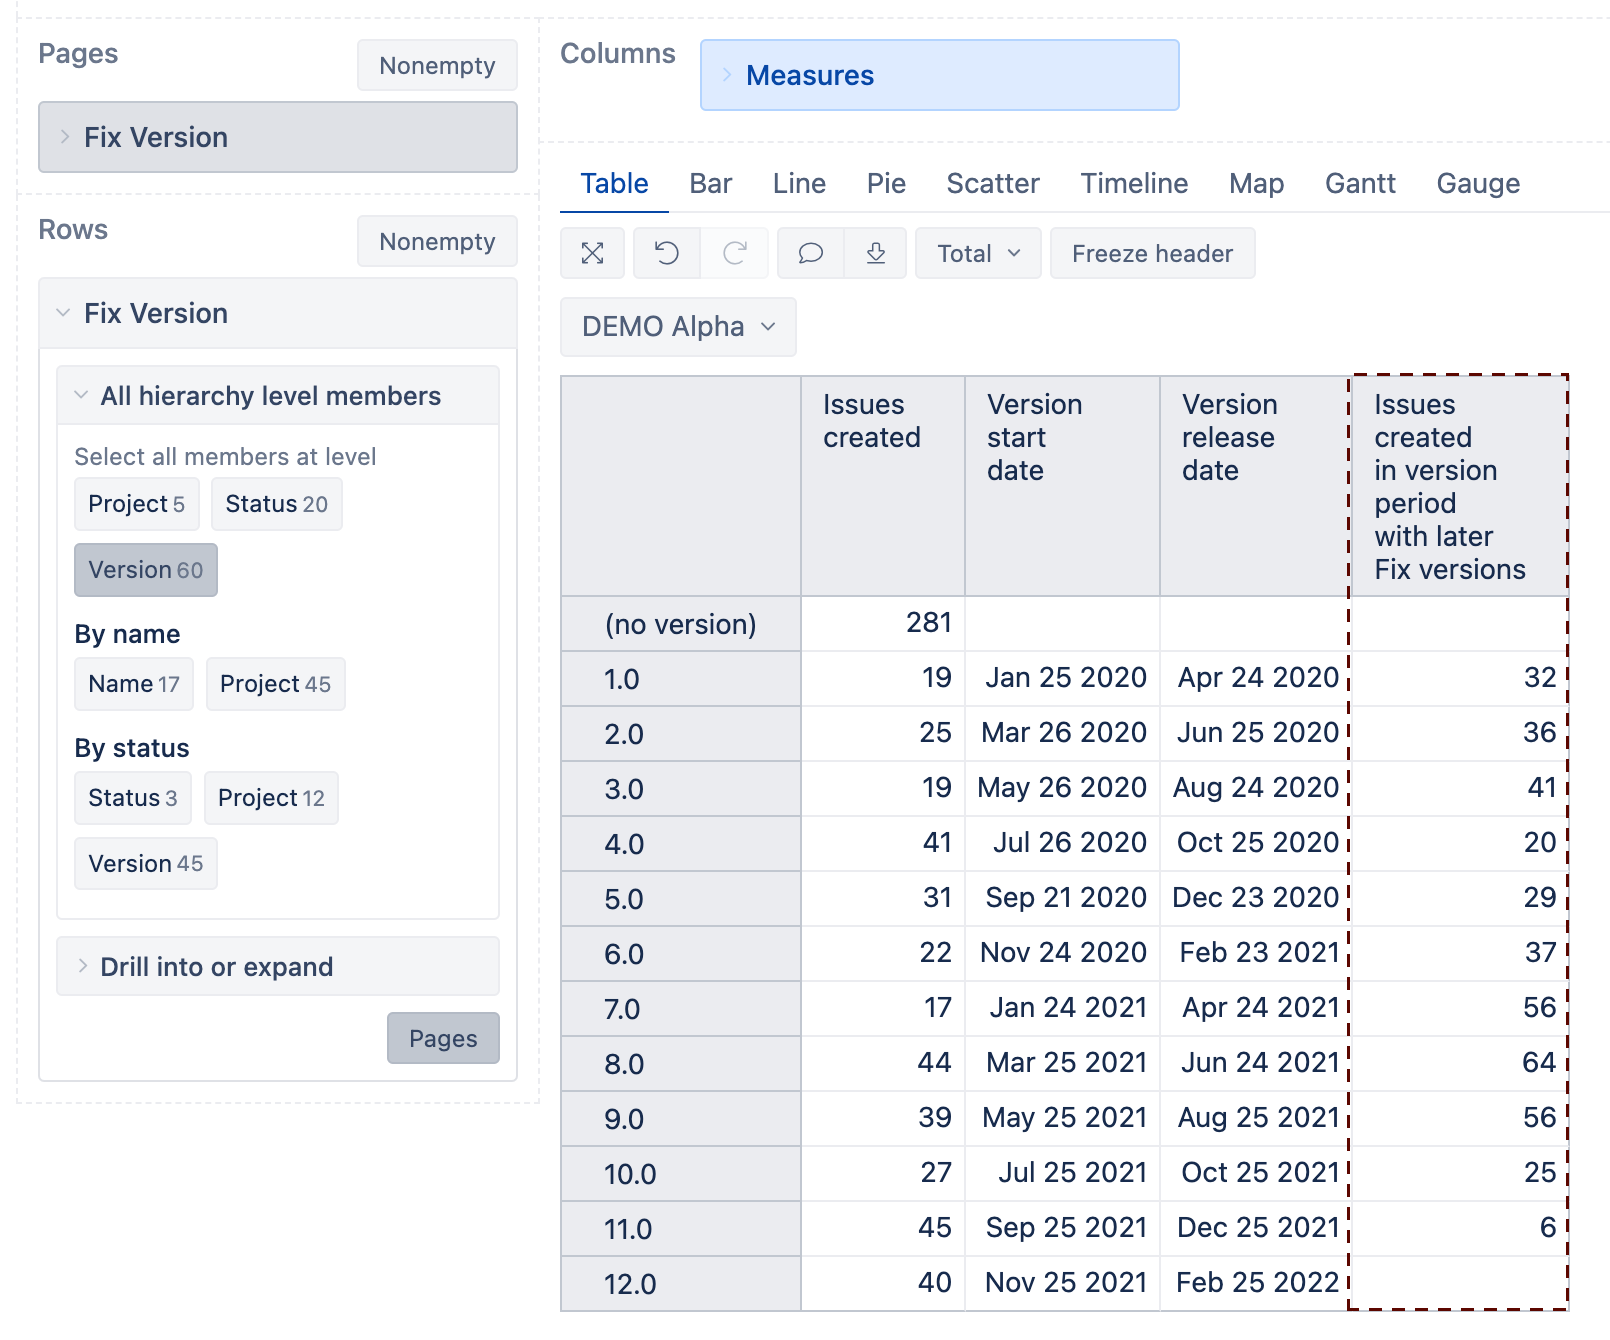
Now what we would like to add to this report is how many issues were created during the Fix Version cycle but got deferred to a later Fix Version.

So in the example, there were 836 issues with Fix Version 2022.01.0.0. 477 of these issues were created before the Fix Version cycle began on Dec 12 2021 and 359 of these issues were created during the Fix Version cycle from Dec 12 2021 thru Jan 22 2022. These 836 issues were fixed in 2022.01.0.0.

Now we need to know how many issues were created in the Dec 12 2021 thru Jan 22 2022 time frame but not fixed in 2022.01.0.0. I have not been able to get this. Can you help?

Hi @alanv25,

First, I want to point out a typo in the version “2022.01.0.0” version “Fix Version Cycle End (Deploy) Date”. It is way before the start date, and the calculation suggested below won’t yield relevant results.

I know only some details about the report context thus, I made several assumptions:

  • The Fix Version dimension is in the rows with the default hierarchy
  • you are interested in versions in the scope of a single Project
  • the example uses default version start and release date properties

See the suggested formula below:

Sum(
  -- find versions after the current version by start dates
  Filter(
    [Fix Version.By status].[Version].Members,
    DateCompare(
      [Fix Version.By status].CurrentMember.Get('Start date'),
      [Fix Version].CurrentMember.Get('Start date')
    ) > 0
  ),
  -- date range of the current version start and release
  Sum(
    {[Time].[Day].DateMembersBetween(
      [Fix Version].CurrentMember.Get('Start date'),
      [Fix Version].CurrentMember.Get('Release date')
    )},
    -- a number of issues, with changed Fix version context to the version Project
    ([Measures].[Issues created count],Ancestor([Fix Version].CurrentMember,[Fix Version].[Project]))
  )
)

It looks through all versions from the “by Status” hierarchy to compare the current version start date to all version start dates and retrieve the ones after the current one. The hierarchy change is necessary to compare a current row member property with the same dimension members from a set.
Next, it looks at the Time dimension range of the current version and retrieves the number of issues created in that period.
Unfortunately, the context changes affect the measure “Issues created count”, and it will return multiple counts for one issue if the issue has several future versions.

The report could look similar to the one below:

Visit the eazyBI documentation page for more information on defining calculated measures -​ Calculated measures and members.

Best,
Roberts // support@eazybi.com