Hi,
I need to create a query to generate a report on open vs closed bugs for a particular project. Could you please help.
regards
Ashwin
Hi,
I need to create a query to generate a report on open vs closed bugs for a particular project. Could you please help.
regards
Ashwin
Hi,
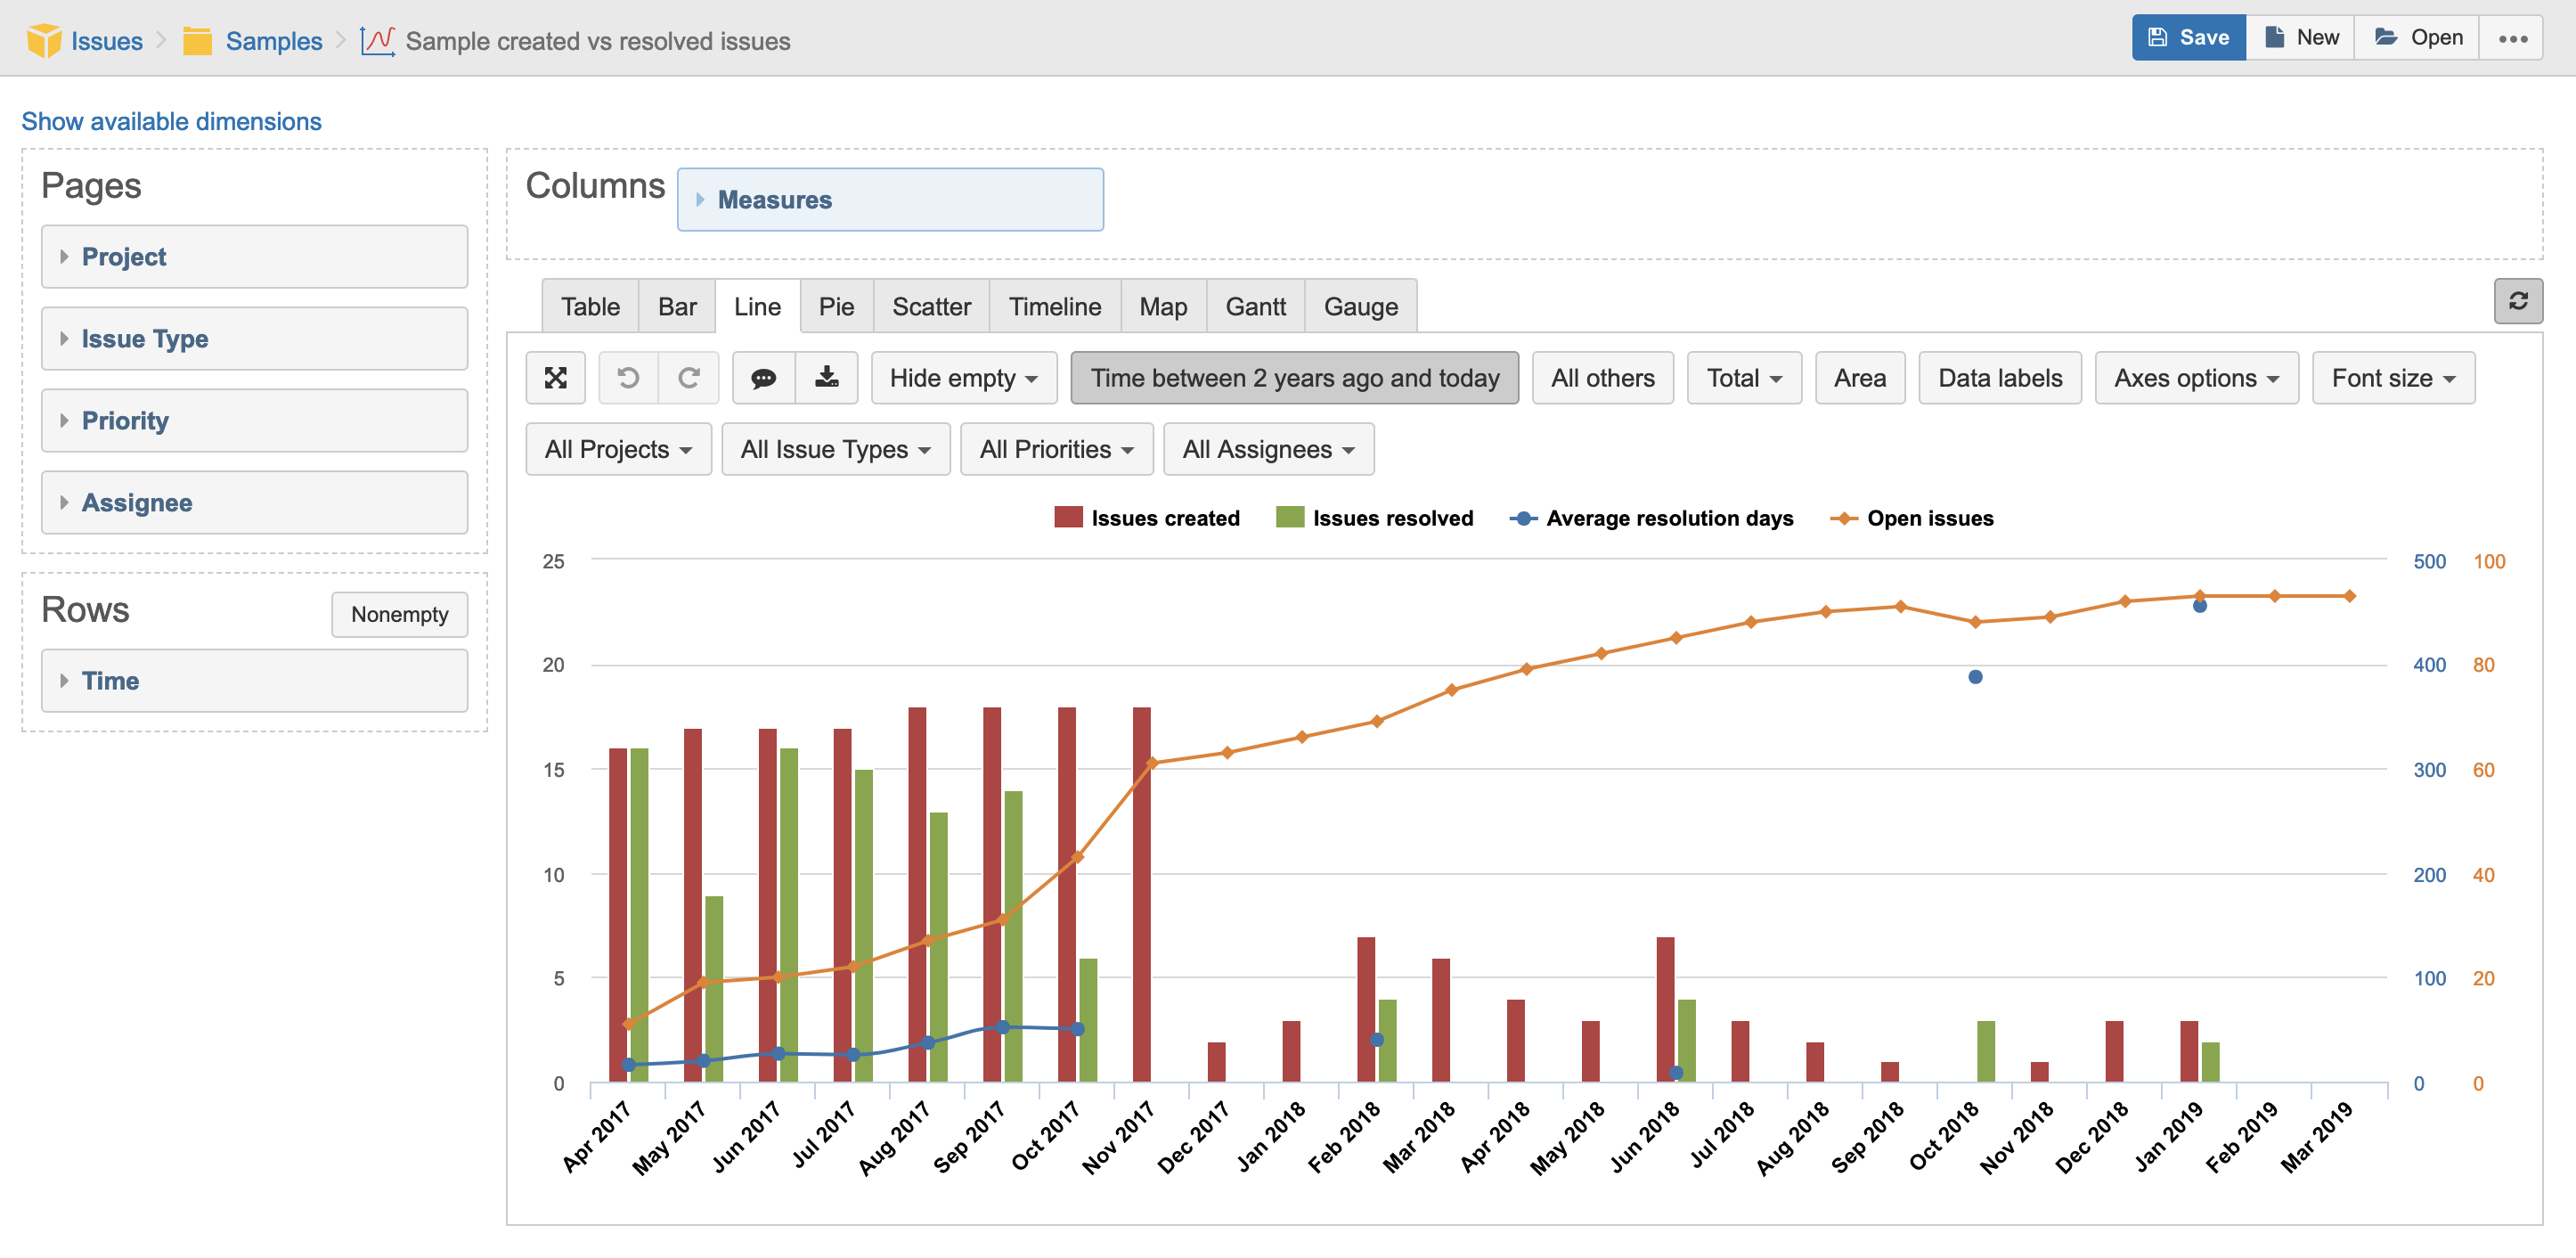
Actually, there should be a sample report (automatically created) on your account which shows the number of open and resolved issues. You could start building your custom report from the sample report. If “Time” dimension is not needed in your final report, you could remove it and save your report.
You could also explore other sample reports on our demonstration account.
https://eazybi.com/accounts/1000/dashboards/14871-chart-types
Please also find the description about all default eazyBI measures on our documentation page:
https://docs.eazybi.com/eazybijira/getting-started/measures-and-dimensions
Martins / eazyBI support
I would like to implement this example on my eazyBI demo instance, could you help me understand how I can display values in columns “Issues Resolved Overview” and “Rolling predicted date” using an example Jira Service Management project? Which custom fields should I configure/add?
@kalos
what exactly do you mean by “Issues resolved overview” - could you elaborate on that measure? How would you calculate it?
What exactly in your use-case means “Rolling predicted date” and would you calculate it?
Perhaps you can explore this demo report: Project Prediction report - Issues - Jira Demo - eazyBI
It has prediction in it.
Martins / eazyBI support