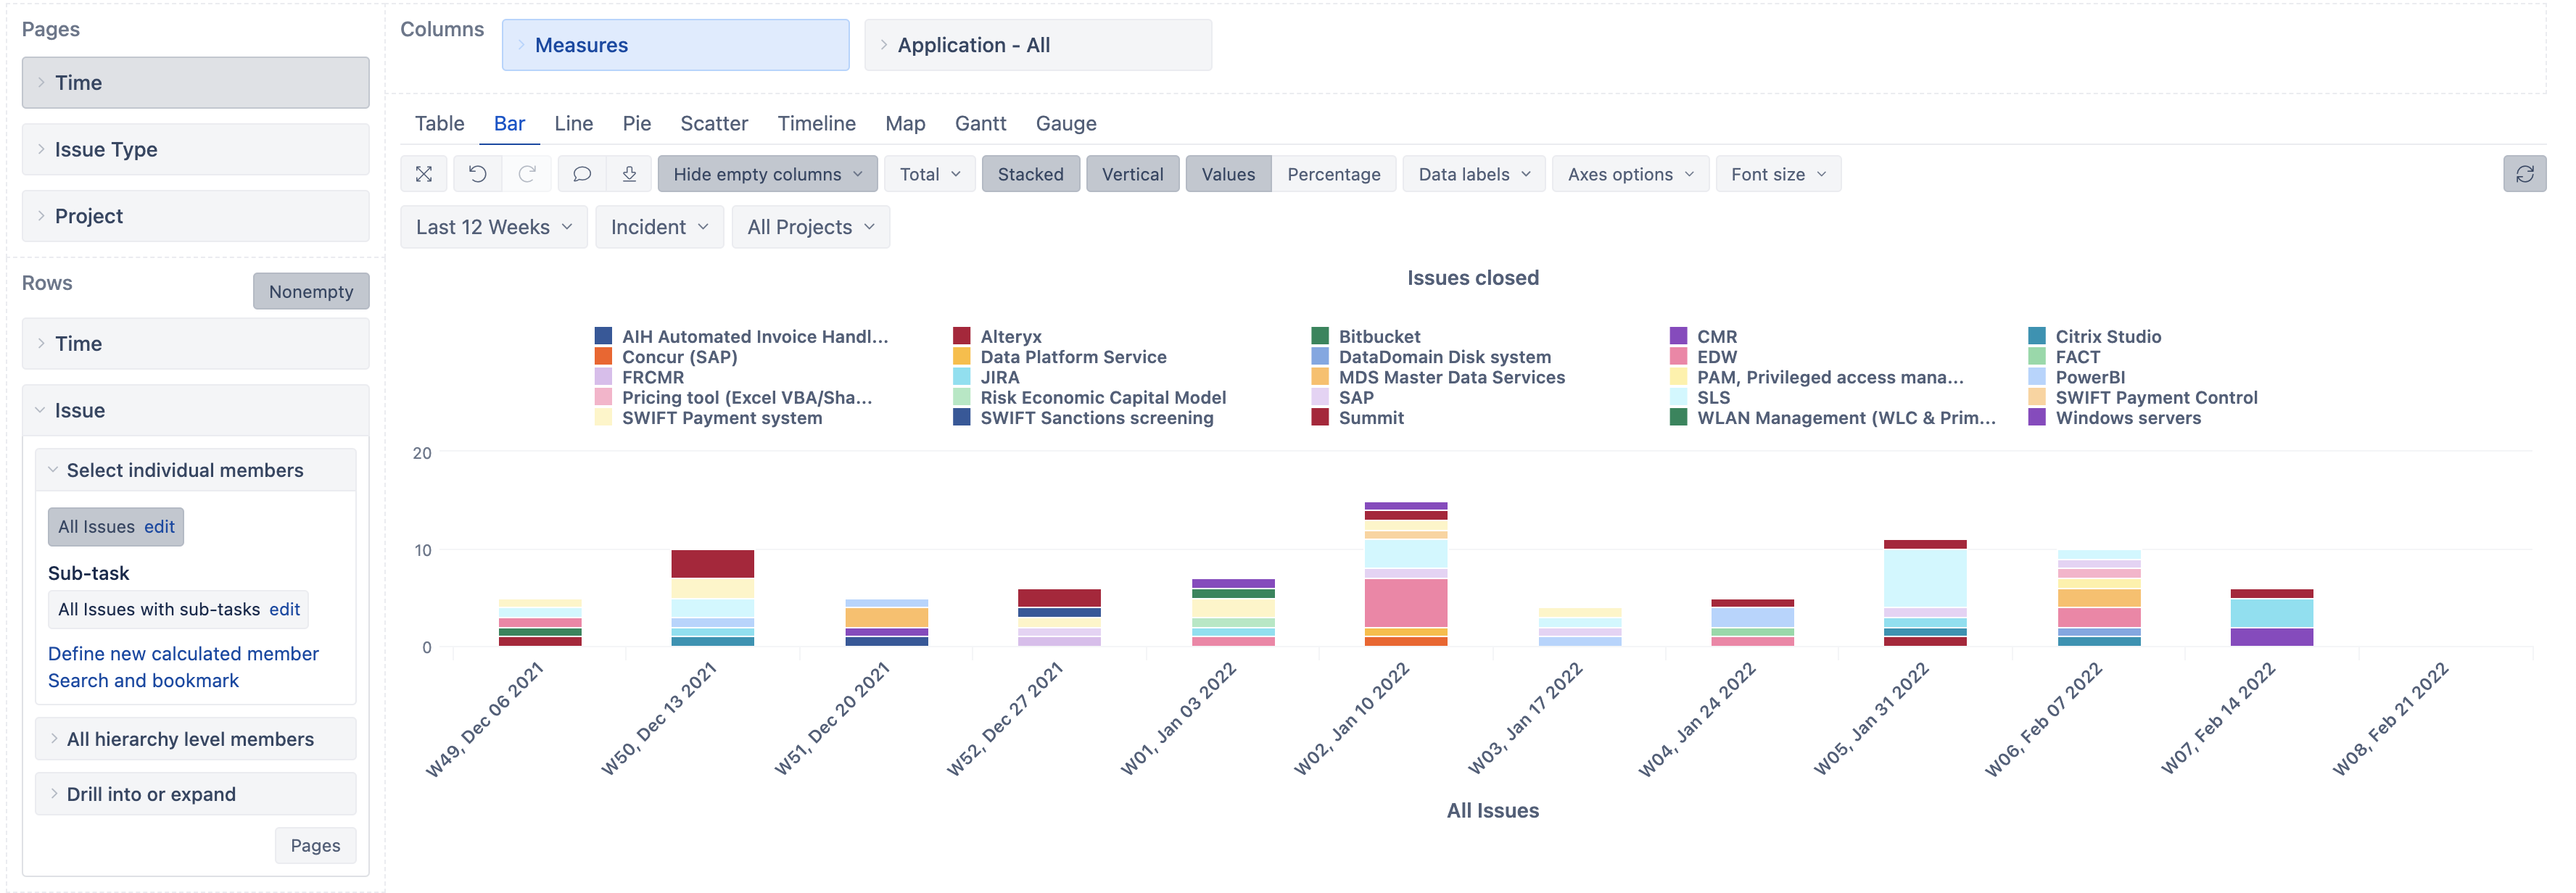
I have created a report that shows the number of closed issues grouped with the application value in the issue from the last 12 weeks. Now I would want the stacked column to be ordered with the number of closed issues for each week so that the biggest value is always on the bottom of the graph.
Unfortunately, that is not possible. You could change the dimension member order in columns by selecting them manually or defining a calculated member aggregating them in a set order. Still, it is not possible to order them for each row separately.
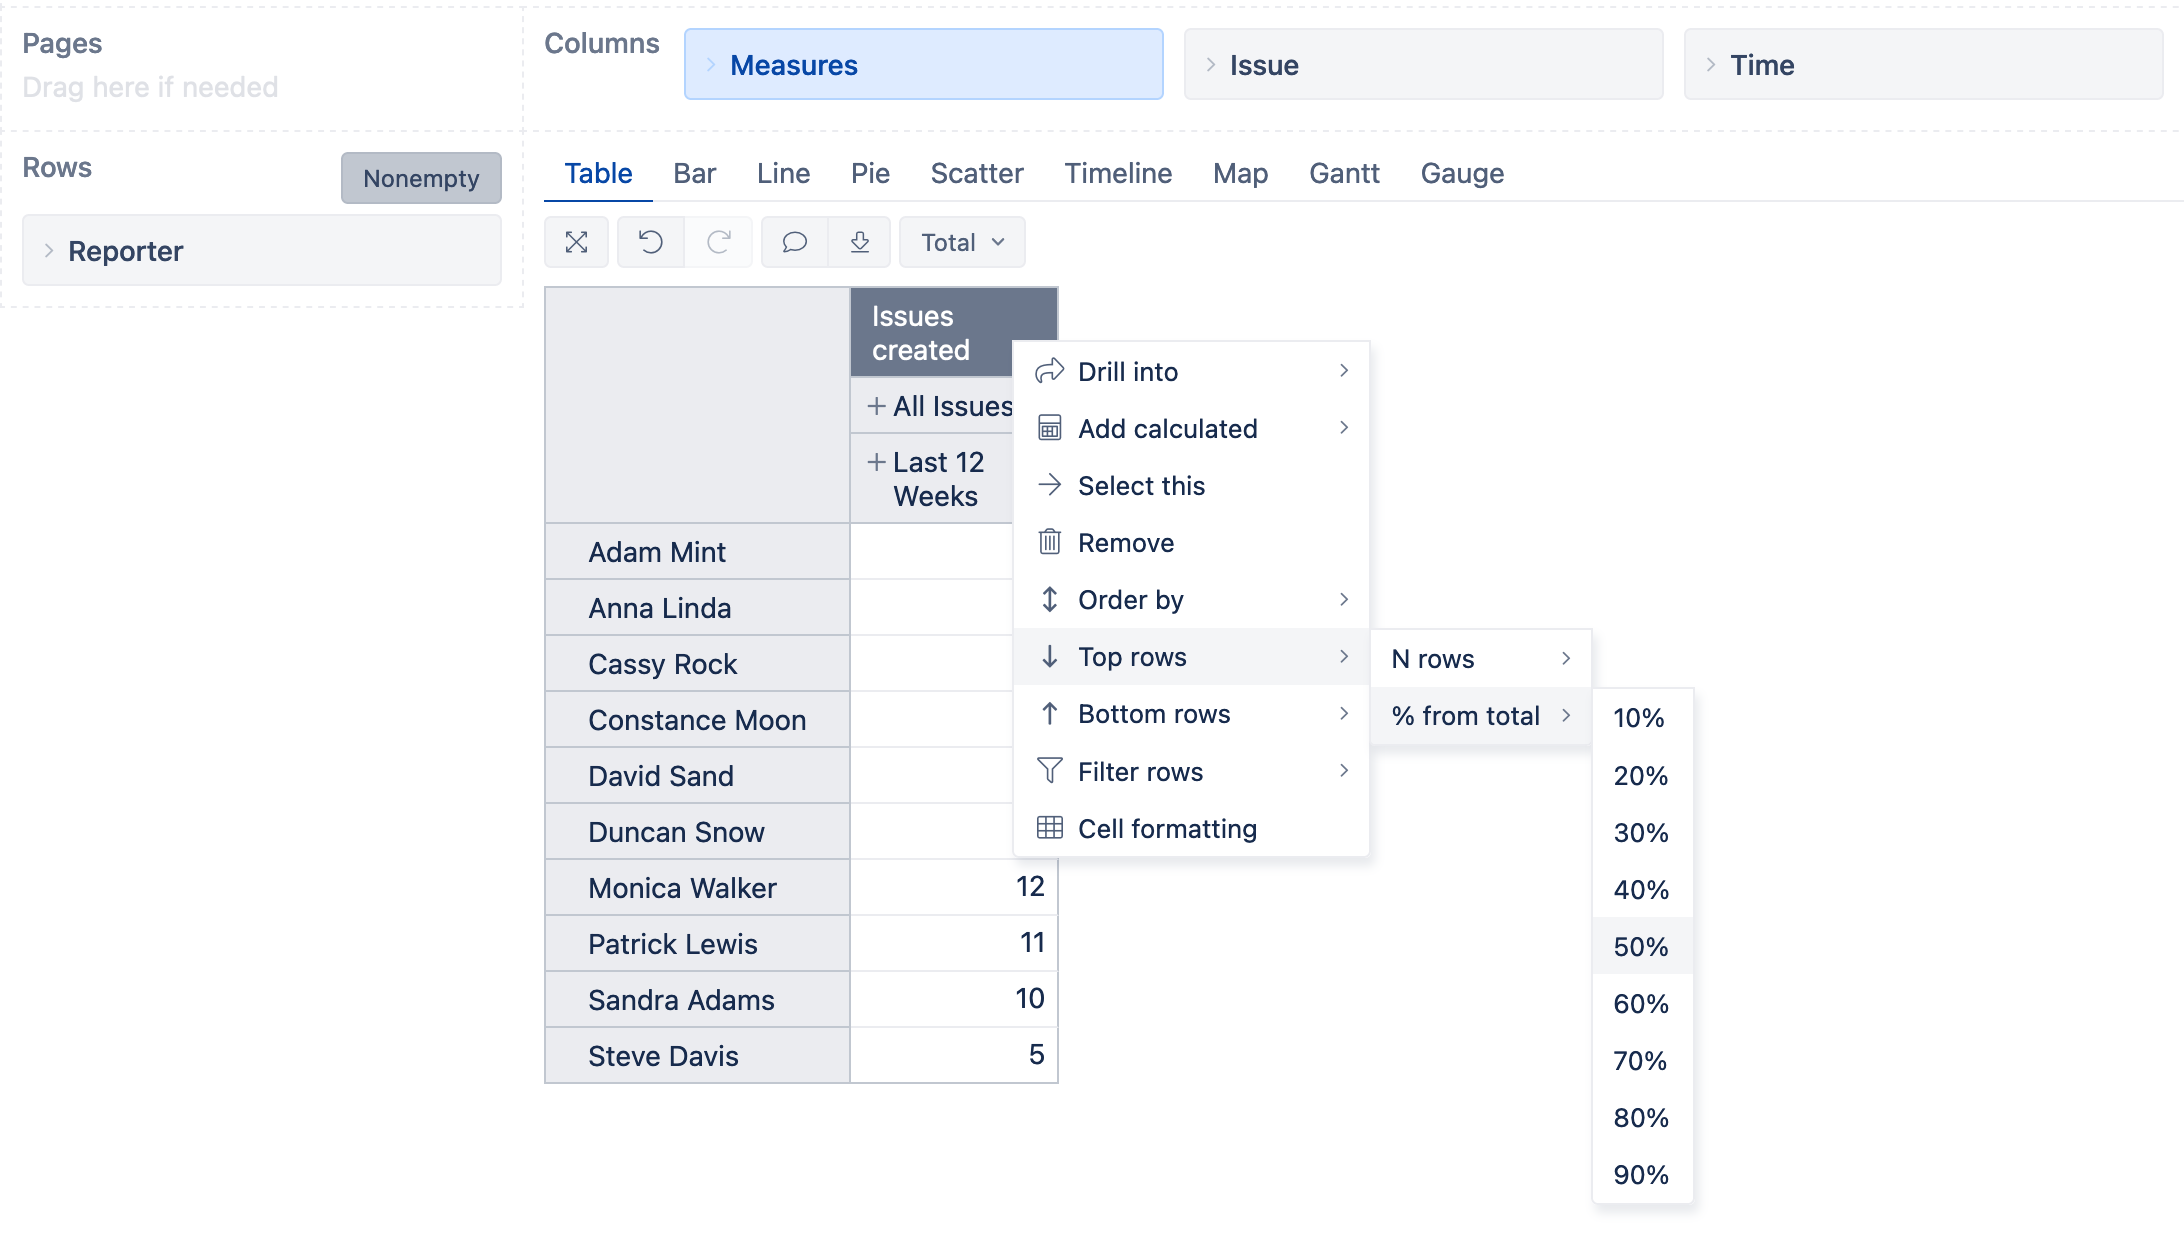
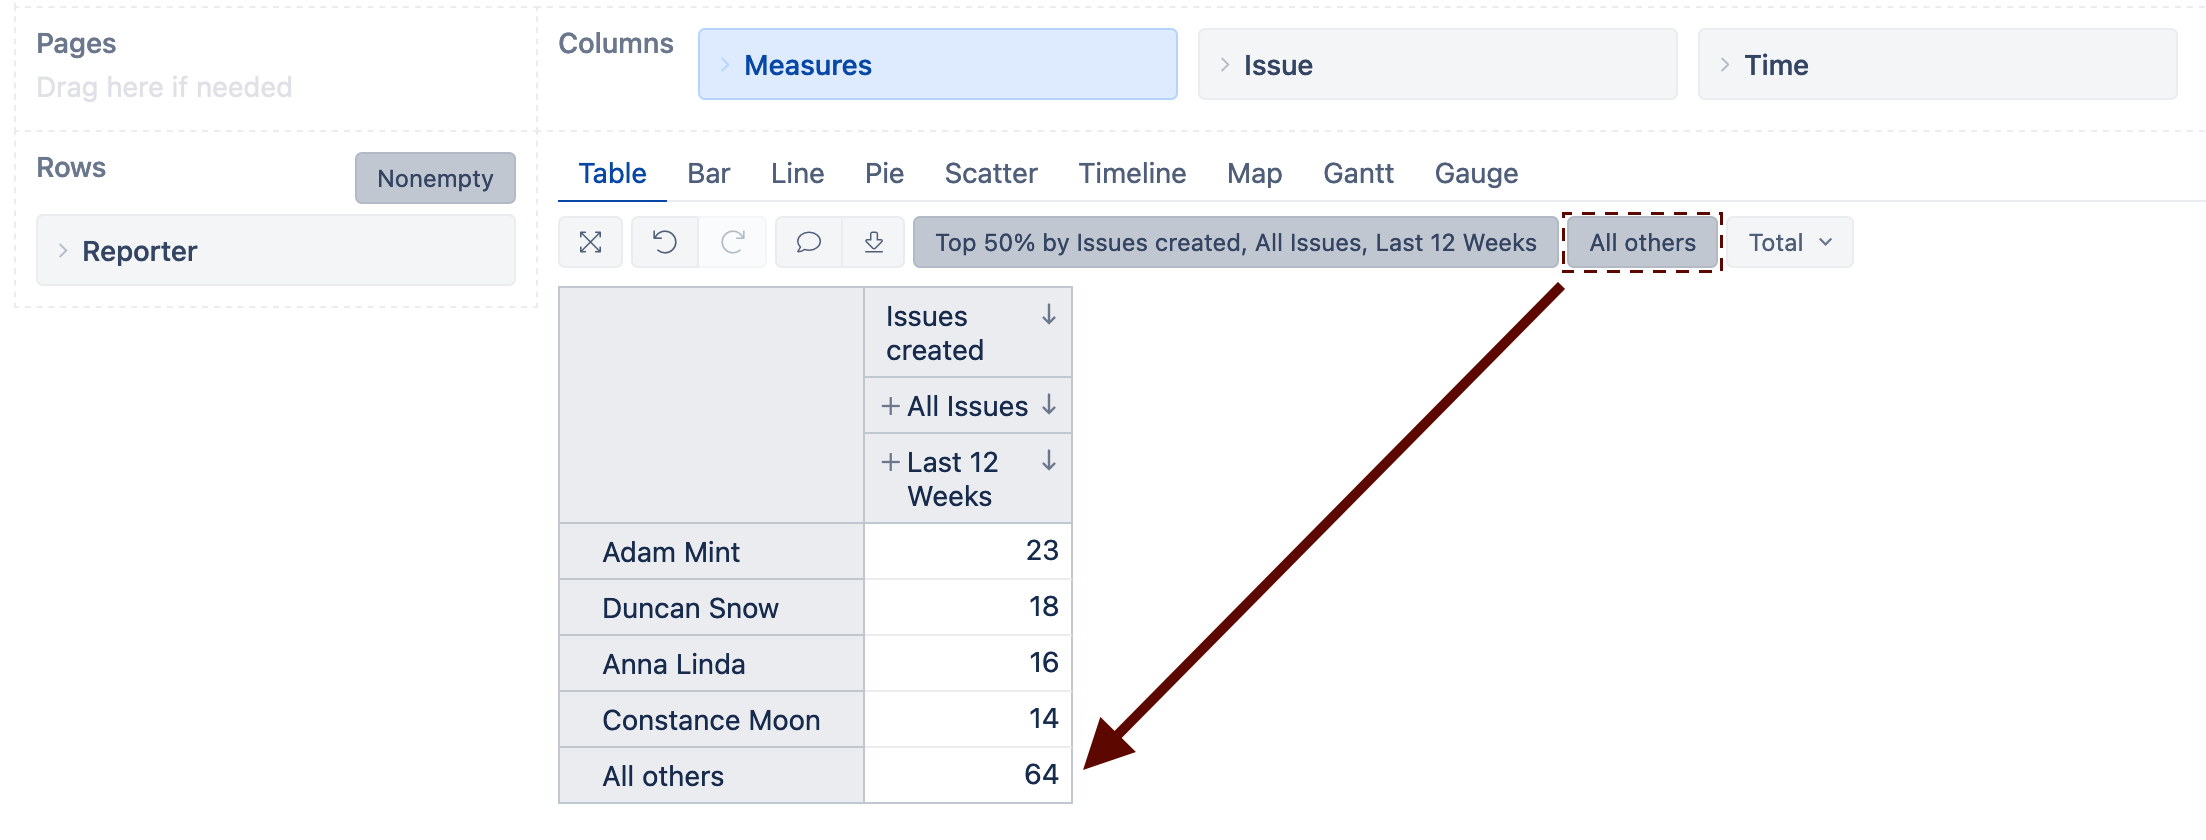
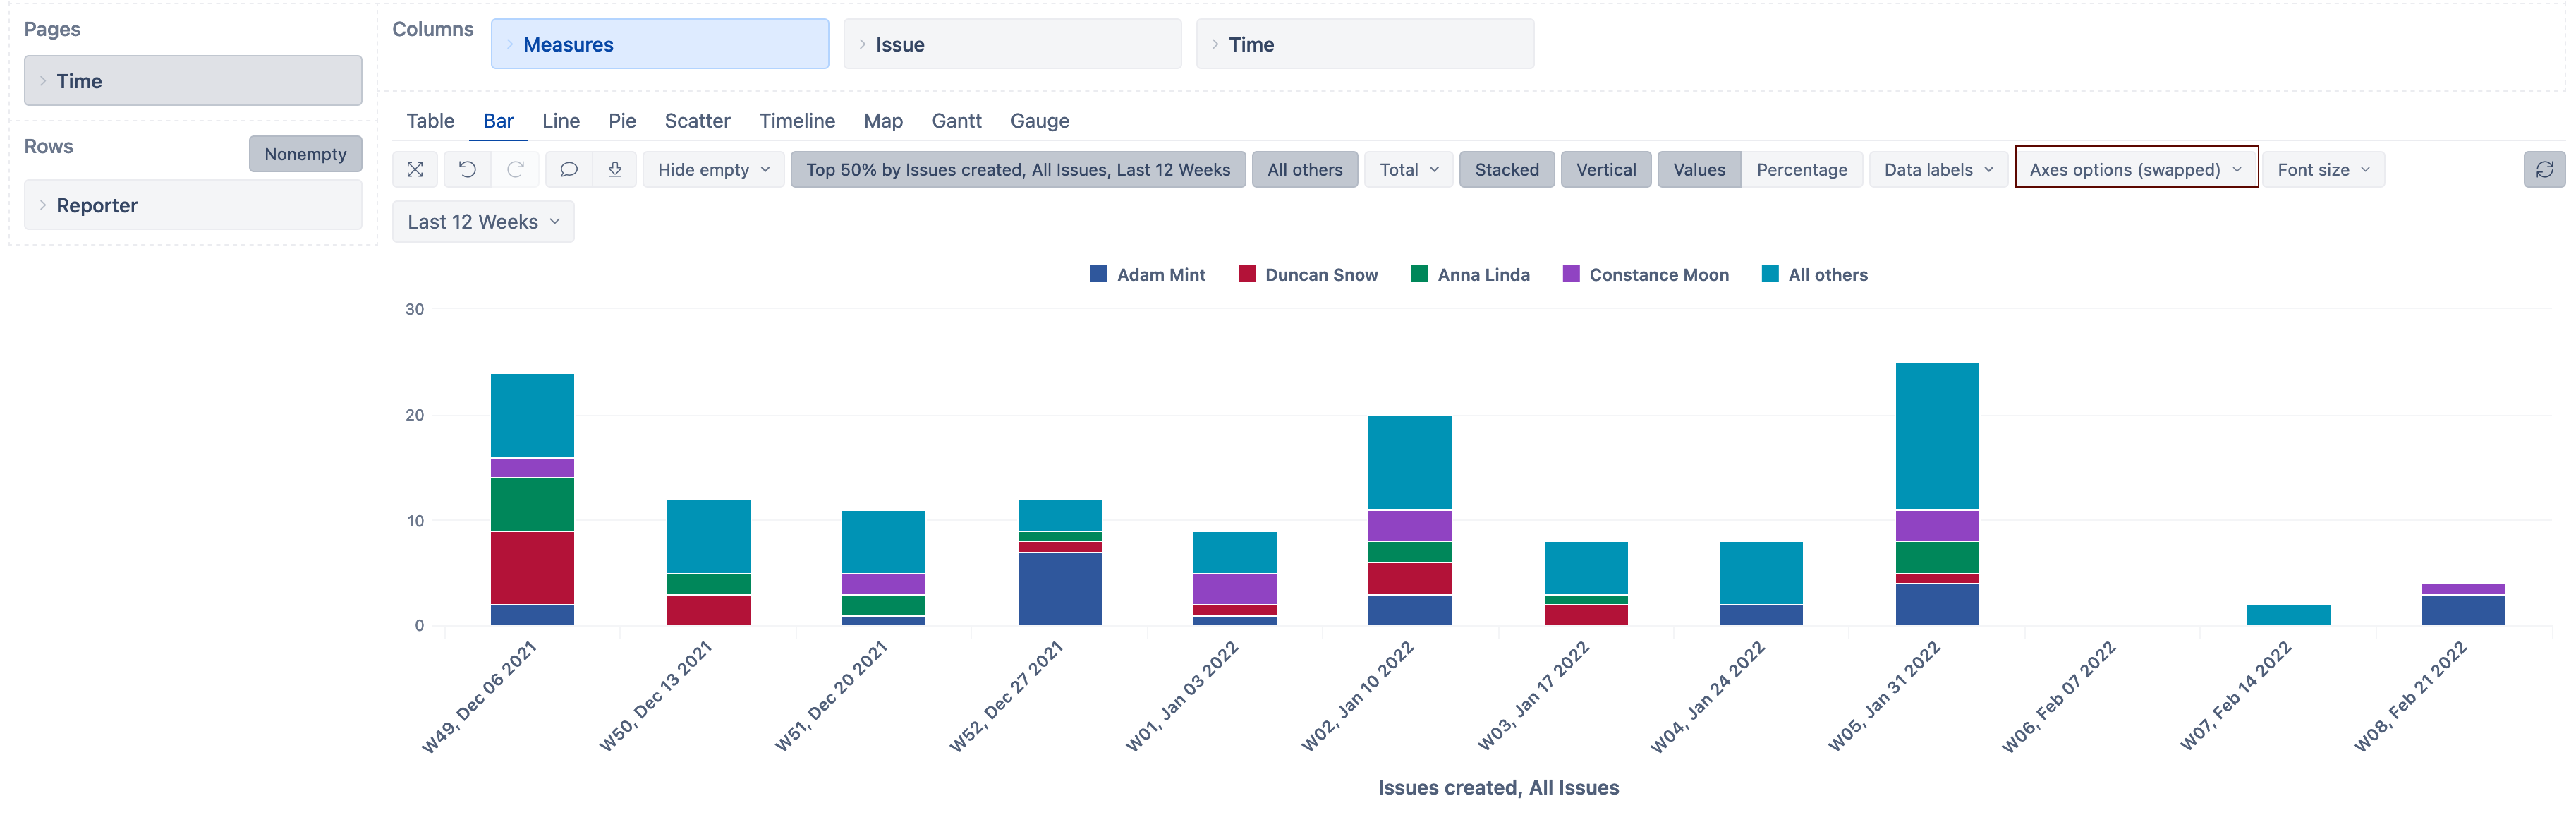
To limit the number of Application - All dimension members displayed in the report, you can switch places with the Time dimension and display it in rows. Then you could display the “Top rows” for the Last 12 Weeks and include the rest in the “All others” member. See an example below:
First, display the Top rows for the full period: