Hi Martins,
Thanks a lot for replying! One step further regarding using the right terminology but I did not get it to work unfortunately. I am convinced EazyBI is a very powerful tool and know exactly what I want to use it for, but am starting to doubt whether I can the potential out if it. I feel that what I am trying to do should be fairly easy or I may simply not be smart enough 
As I understand it, there are 3 axes in which one or more dimensions can be put, simply said:
Pages: adding dimensions here will add the dropdown filters that allow for easily restricting the data shown in the graph.
Columns: adding dimensions here allows the selection of data shown in the graphs/tables. In case of a bar chart, for every additional measure/dimension, another bar will be added
Rows: adding dimensions here determines the range for the x-axis, in case of a vertical bar chart
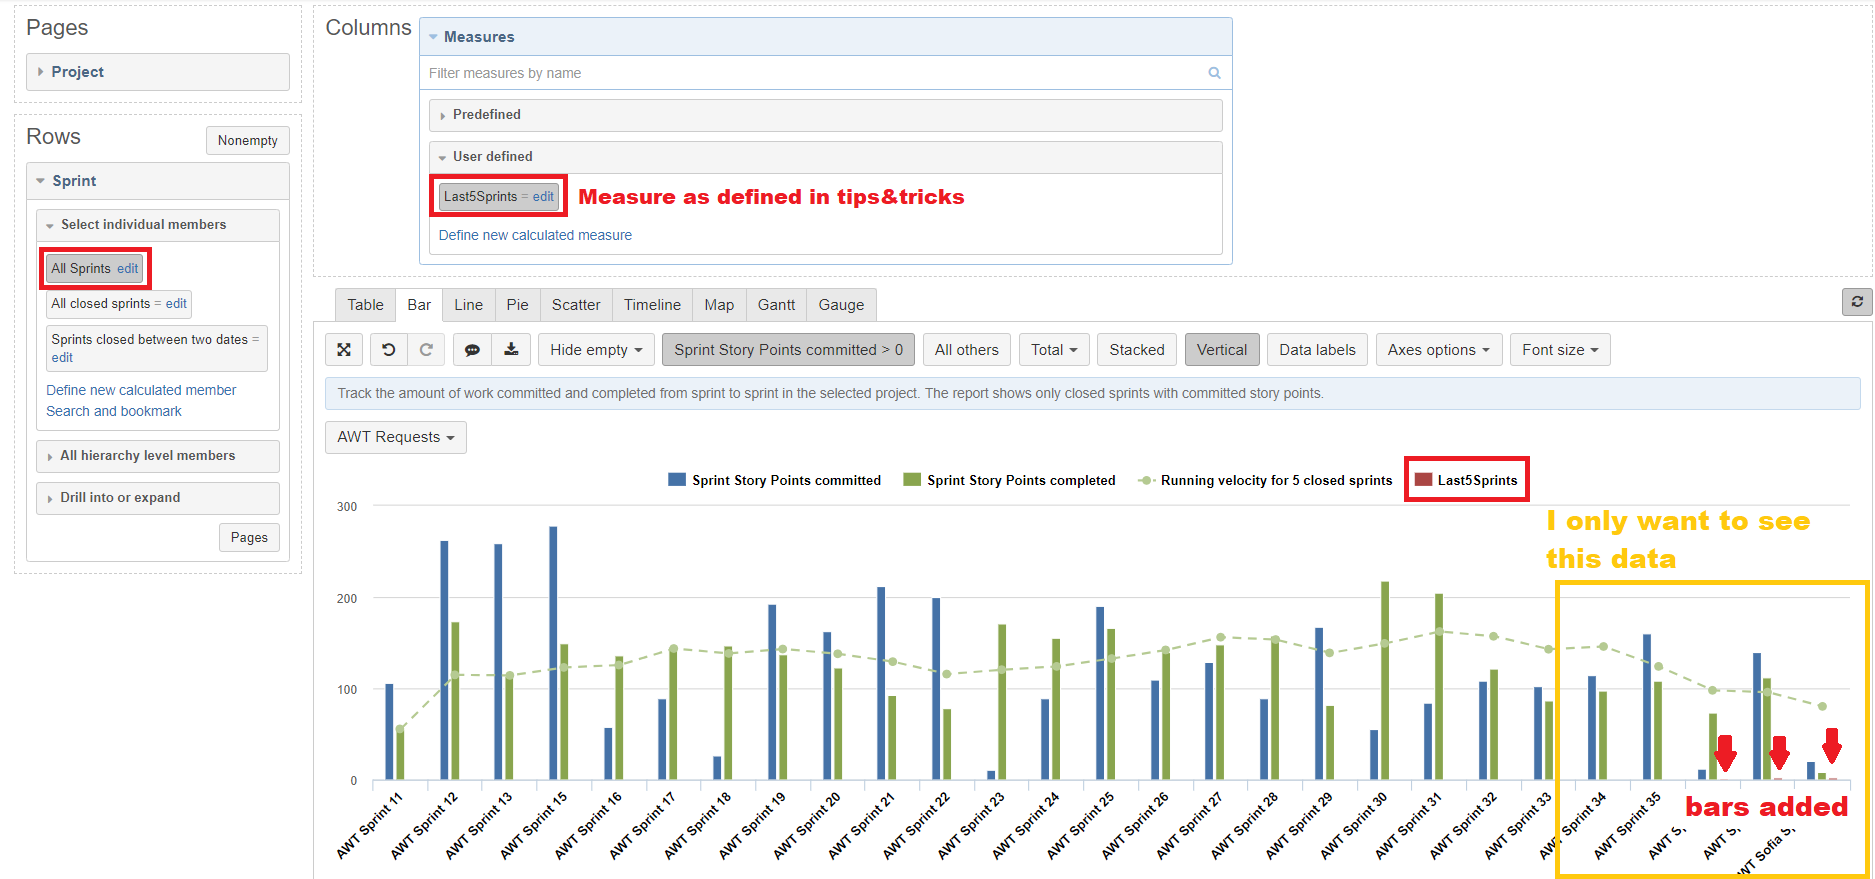
So when reading your reply, and adding the calculated measure to the measures dimension, I got the result that I was expecting based on my assumption above -> another bar was added to the graph, for the last 5 sprints only (so something is working  ) but all sprints are still there and the graph is pretty much unchanged from before I enabled the calculated measure (last 5 sprints). You mention in the instructions “filter the report for the last 5 closed sprints if you have other dimensions in pages which makes the report context” makes me think that this report context is probably missing in my case.
As the Rows axis determines the members (e.g. Sprints) that are shown on the X-axis, I would assume I have to restrict the amount of sprints shown in the Sprint (Rows) dimensions by creating new calculated members there. From the EazyBI demo account, I also tried copying ‘Sprints closed between two dates’ calculated member without success, it does affect the graph regardless of the dates I define in the code. Why is this a calculated member on your demo account and not a calculated measure? Seems like it is trying to do a similar thing.
I also tried to click ‘Pages’ in the Sprint (rows) dimension to have Sprint also in the pages dimension, but no success there except for being able to select 1 single sprint through the filter dropdown…
My Goal: When I open the ‘Sample Sprint velocity chart’ report and have my data in there. I want to show only the data for the last 5 sprints, not create another bar or change the graph in any other way.
Bonus question: When I enable and disable some calculated members, the graph just disappears and doesn’t come back after disabling the calculated member. Am I the cause of this or is it something the system doesn’t always handle that well? In my mind, a calculated member is equal to a filter, if I turn a filter on and then off again, expect to come back to the start position.