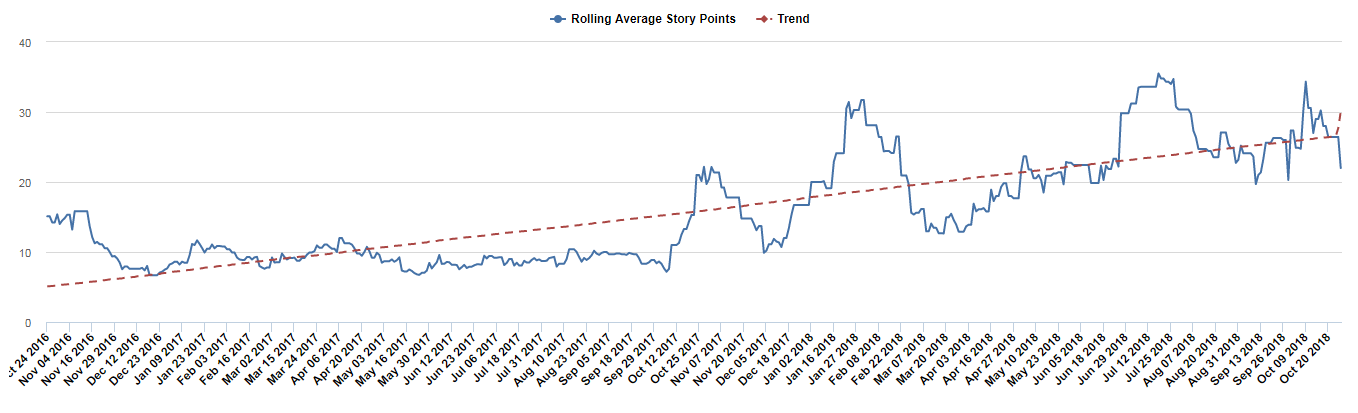
Hello! I am trying to show a trendline for the Planned to Done % across sprints.
The column is [Measures].[Planned to Done %] which is calculated as: [Measures].[Cumulative Story Points resolved] / [Measures].[Sprint Story Points committed].
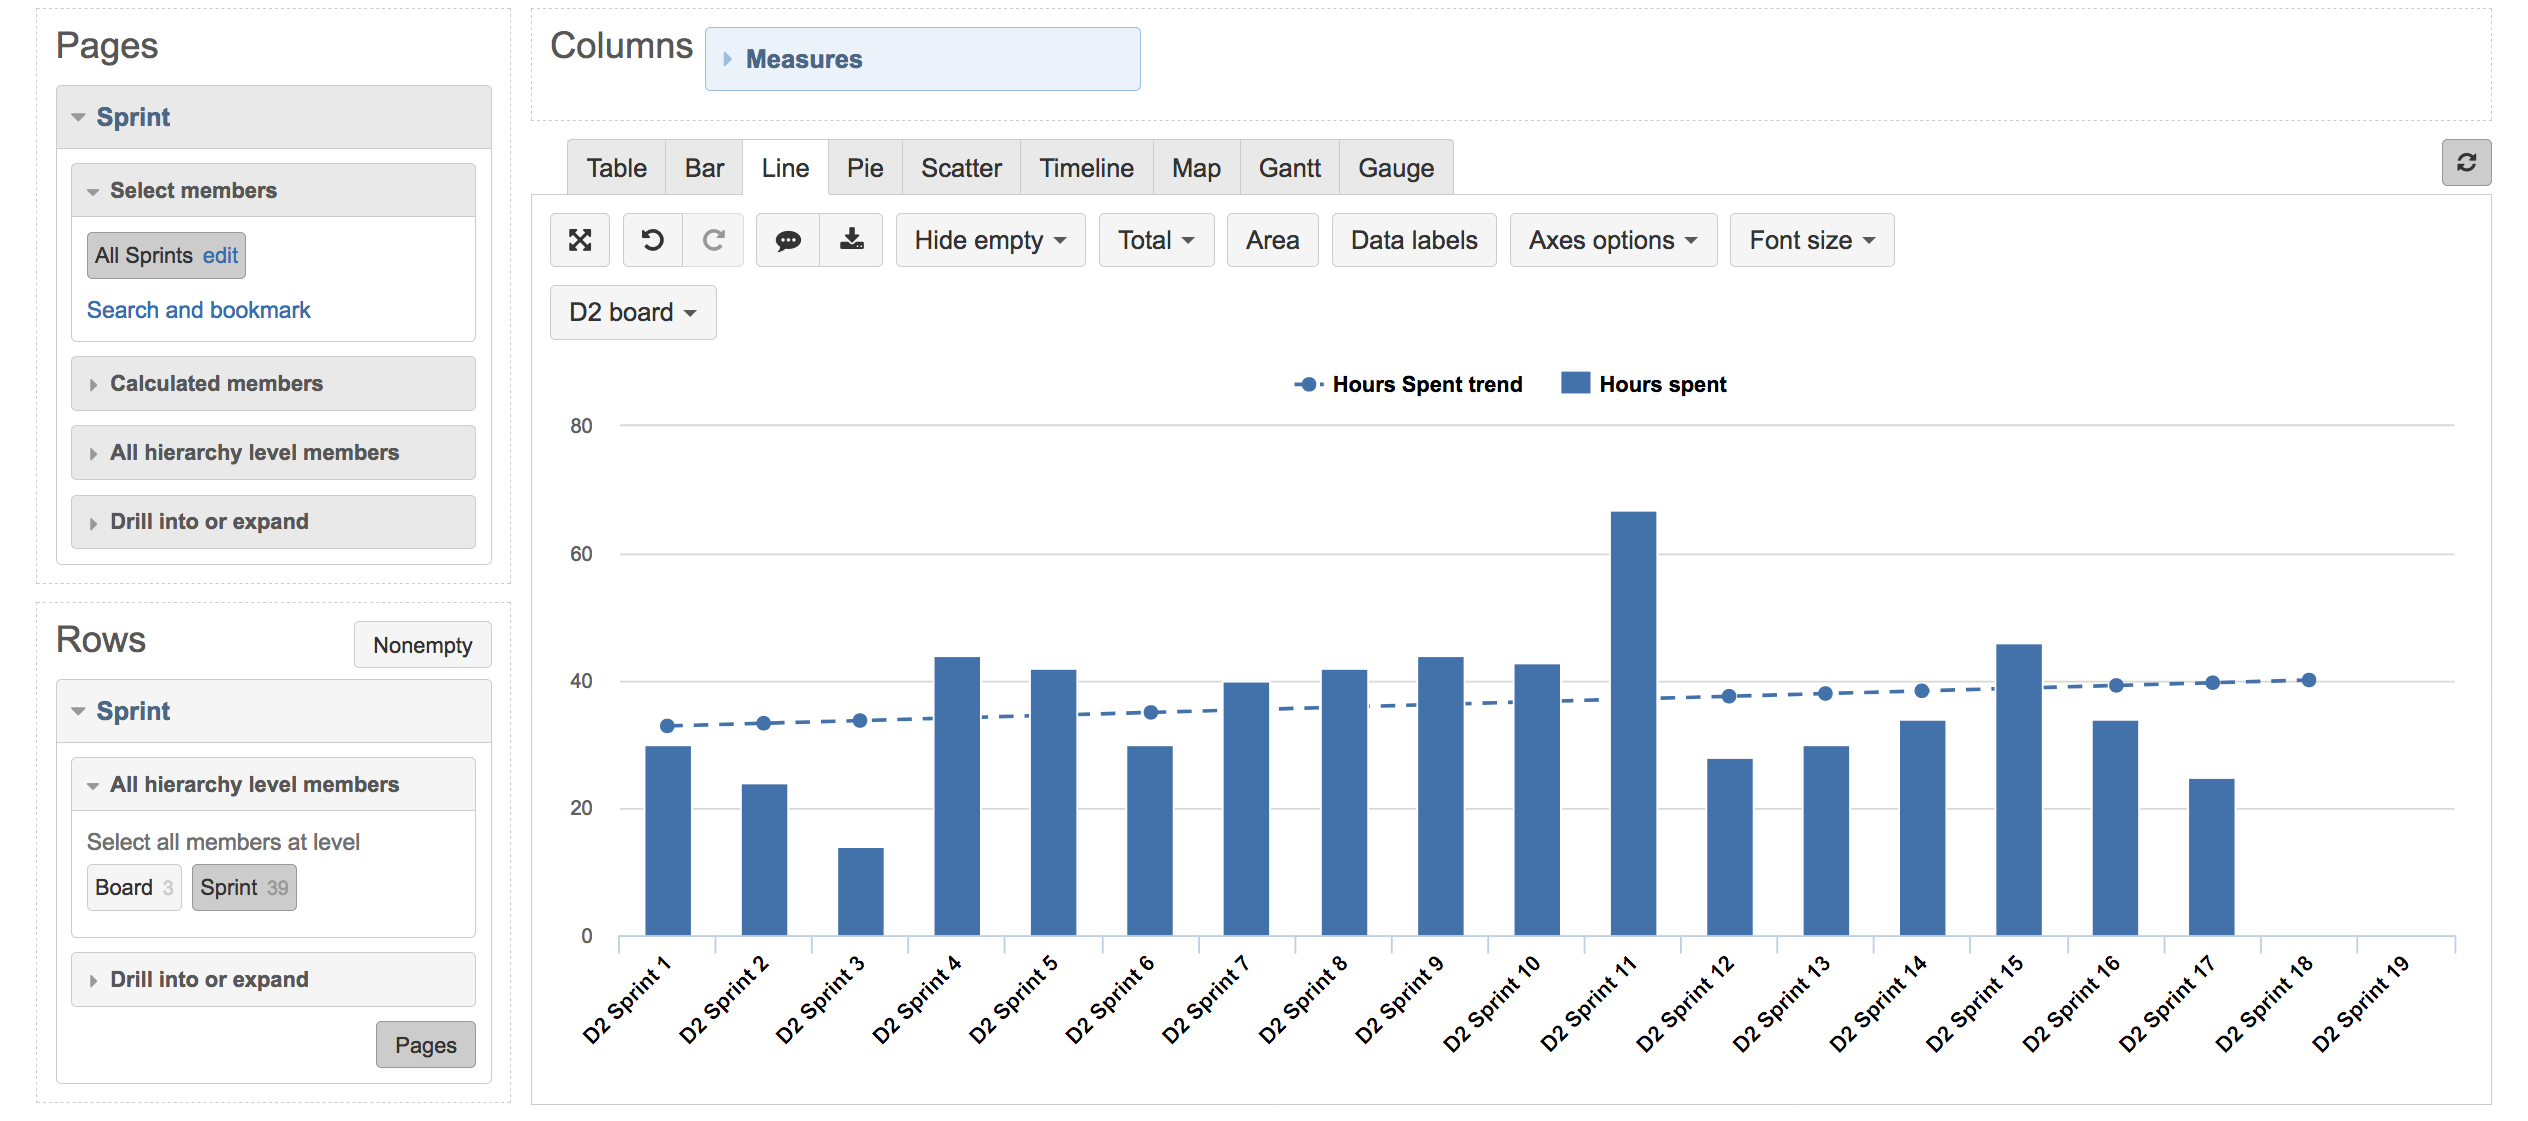
The Rows are sprints.
Table and line chart:

I am trying to get the trend of the Planned to Done % across all Sprints, but I’m struggling with how to do so. I have created the following Calculated Measure, [Measures].[Done % Trend]:
LinRegPoint(
[Sprint].[Board].CurrentMember,
Filter([Sprint].[Board].Members,
[Sprint].[Board].CurrentMember.Name MATCHES ‘CC Dashboards’
),
[Measures].[Planned to Done %],
[Sprint].CurrentMember.get(‘Start date’)
)
I have tried MANY variations for the LinRegPoint, all unsuccessfully. The code above is just the latest attempt. Any assistance would be GREATLY appreciated!