eazyBI allows importing any numeric and date custom field as meaures. Each custom field will have a set of measures in Measure section Predefined subsection Custom fields.
For a numeric custom field Apples there should be a set starting with the name Apples, for example, Apples created, Apples resovled, etc.
For a date custom field Date of apples there should be a set ending with with date of apples, for example, Issues with date of apples
.
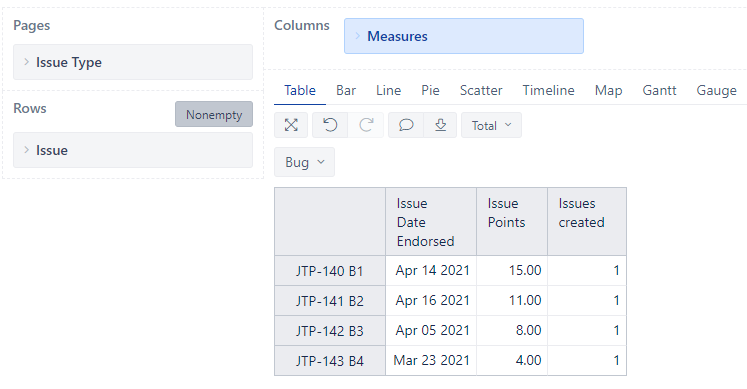
You can use a measure represented by a combination of both of them: Apples with date of apples
Both fields (“Apples” and “Date of apples”) are available in Measures.
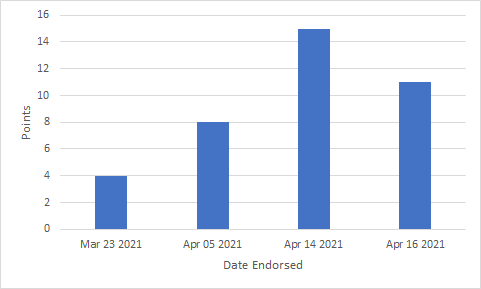
The question here is, how can I create a graph with “Date of apples” on X axis and “Apples” on Y axis, when both fields belongs to the same dimension (Measures)? How to configure a table which will be used to build a graph?