Hi,
The recommended solution for such use case is to use the Resolution Interval dimension.
That will make the report much faster and will not require complex formulas.
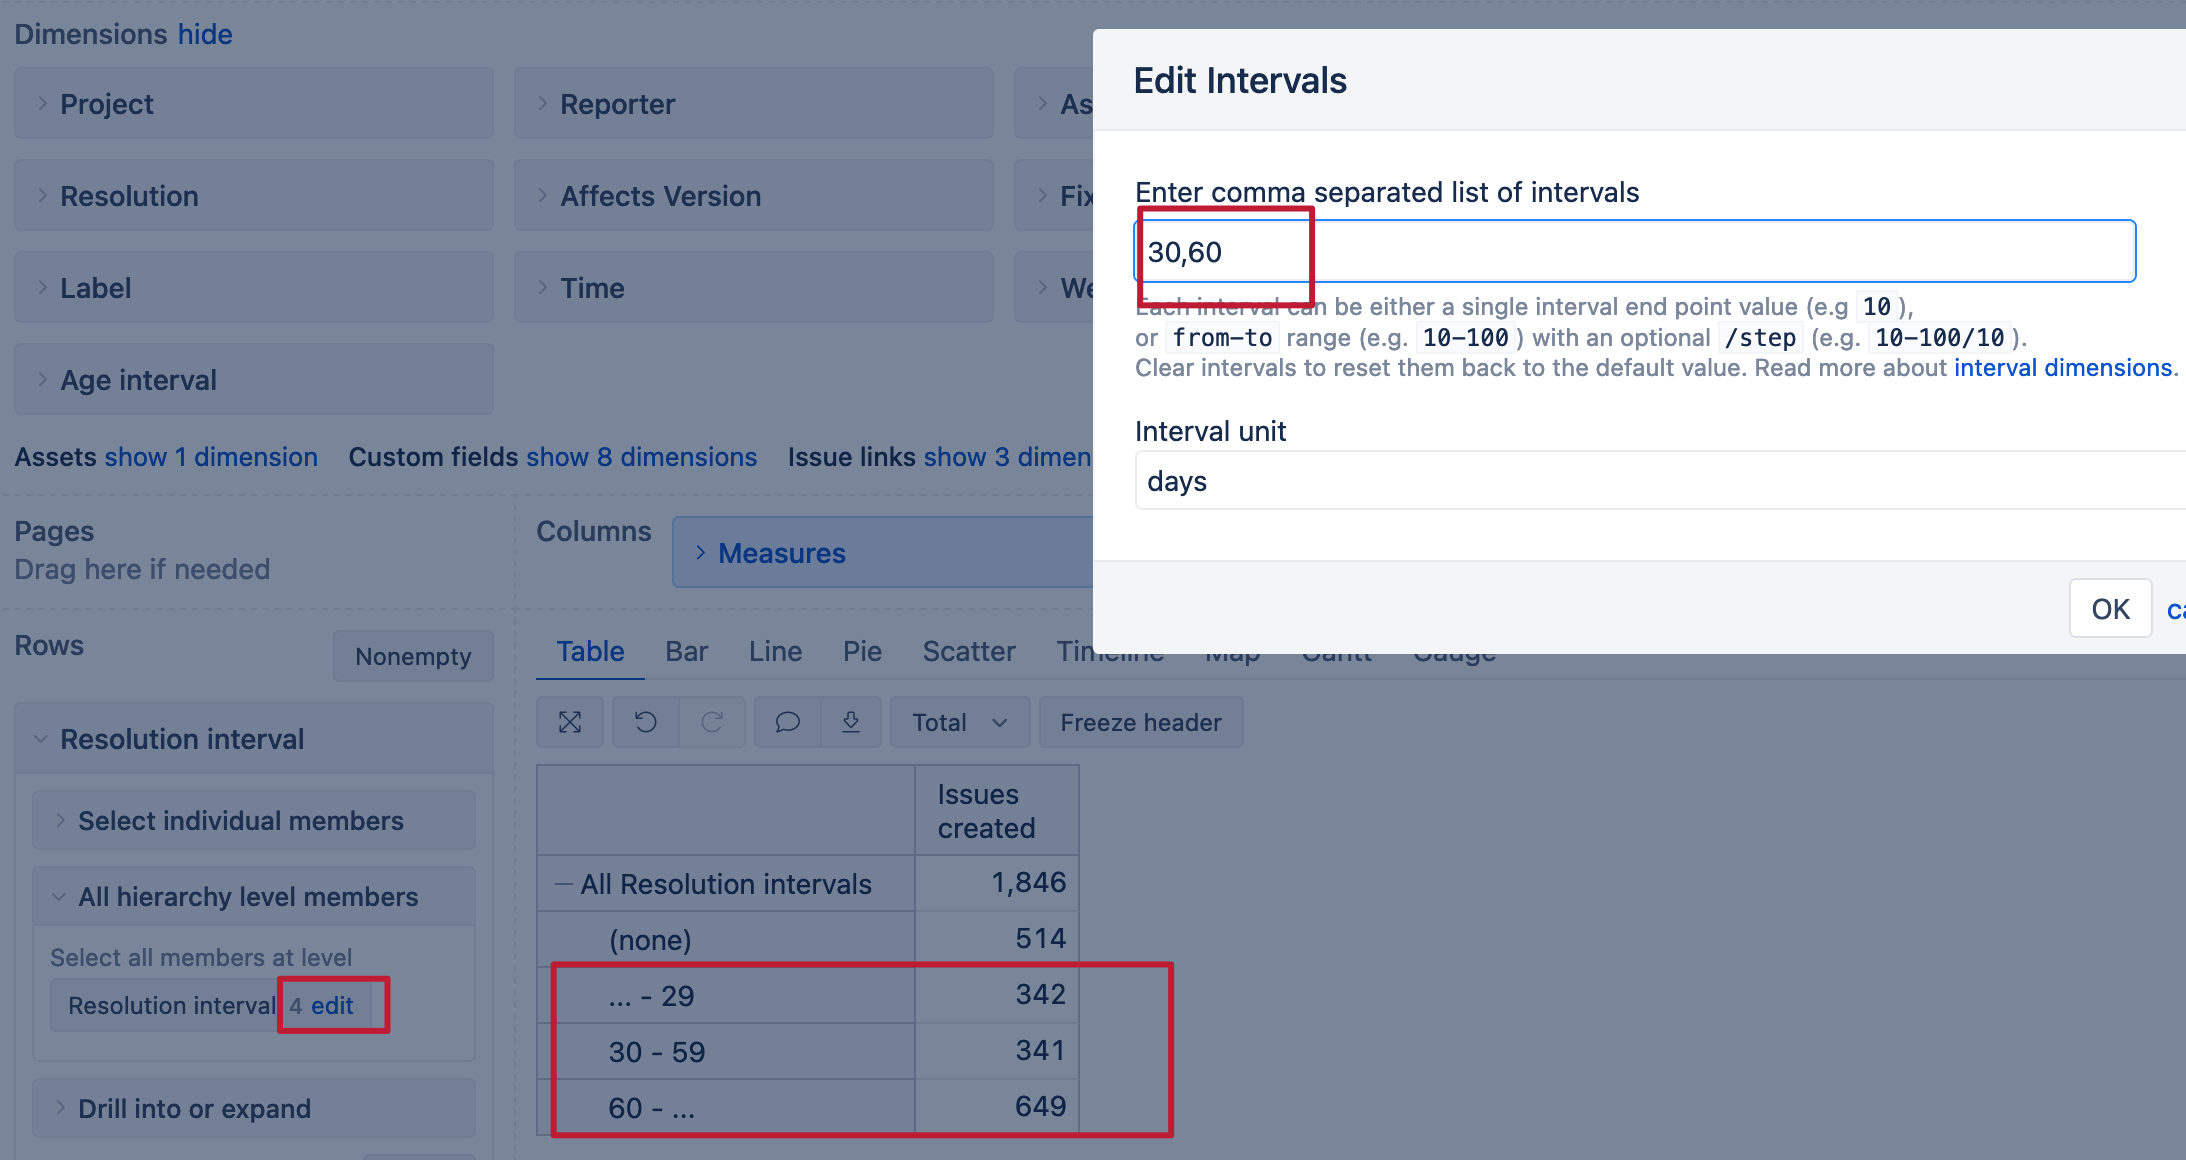
You can enable the interval dimensions in the data import options and configure the intervals accordingly.
I configured my Resolution interval dimension with 30 and 60 days intervals:
I added the Time dimension to the report rows, Issues resolved and the interval dimension to the report columns and switched to the stacked bar chart with percentages:
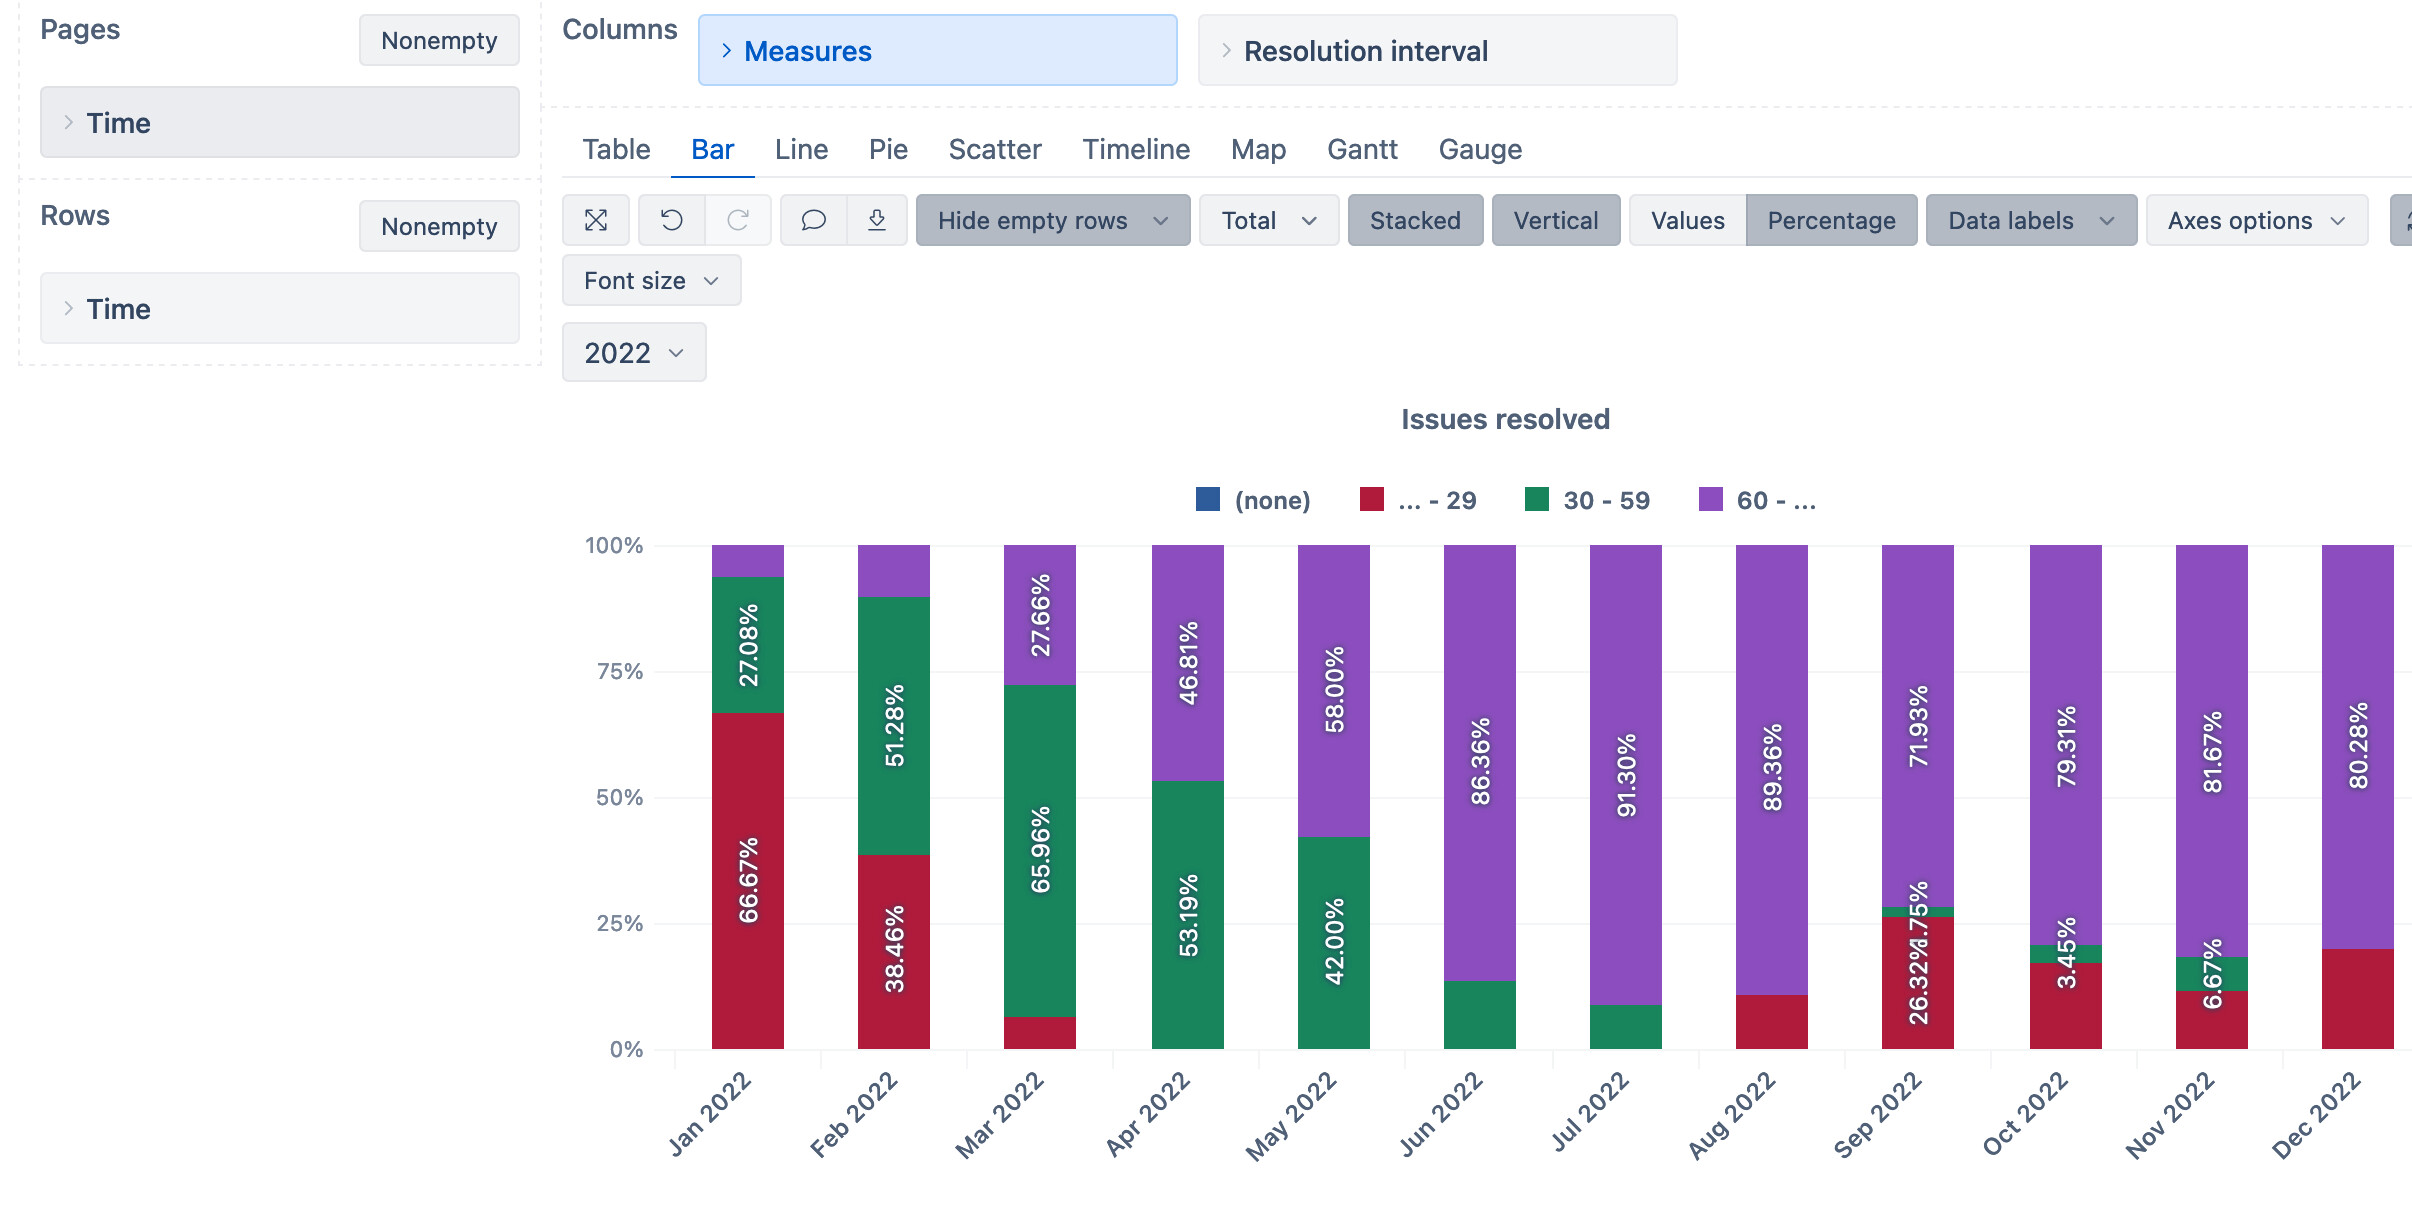
The use of the Issues resolved enables that all page filters will be working.
Kindly,
Janis, eazyBI support