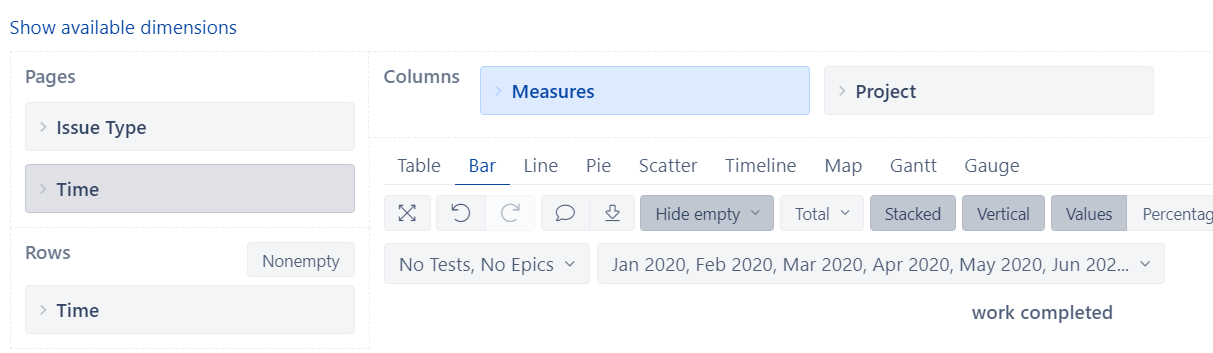
Context: I am trying to create a bar chart report that shows the story points completed per component per month. Something like this:
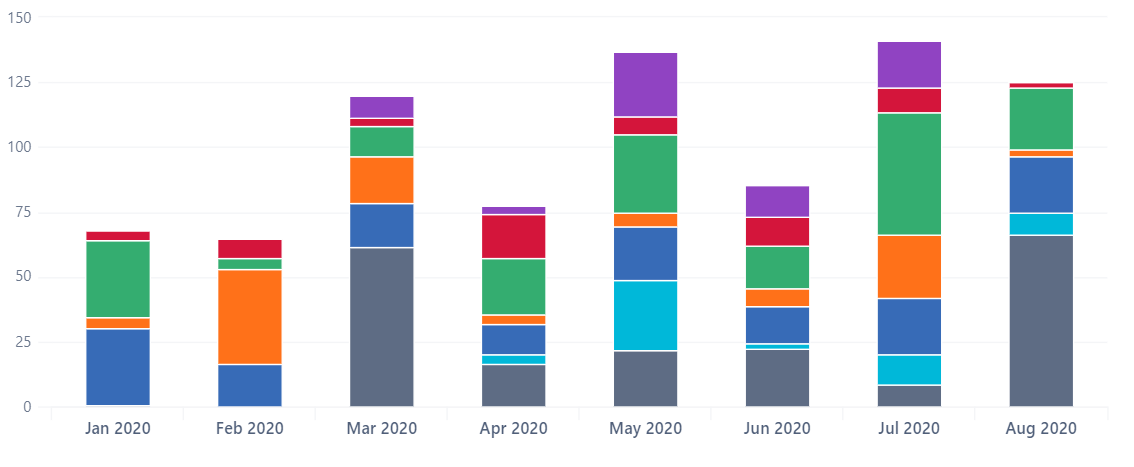
I have the Time dimension under both pages and rows. Then in the columns, I have the measure for story points completed and the Project dimension with particular components selected.
In this particular project, there are a couple of “overarching” components and a number of smaller components that conceptually belong to the larger ones. (Long story.) So … something like this:
- Component A
** Component 1
** Component 2
** Component 3 - Component B
** Component 4
** Component 5 - Component C
It’s possible for an issue to have just an overarching component (i.e., A or B or C). Any issue that has a smaller component will also have the overarching component assigned (A and 1, for example). It’s also possible that an issue will have an overarching component and multiple smaller components assigned (A and 1 and 3).
For this particular chart, I would like to be able to show the following
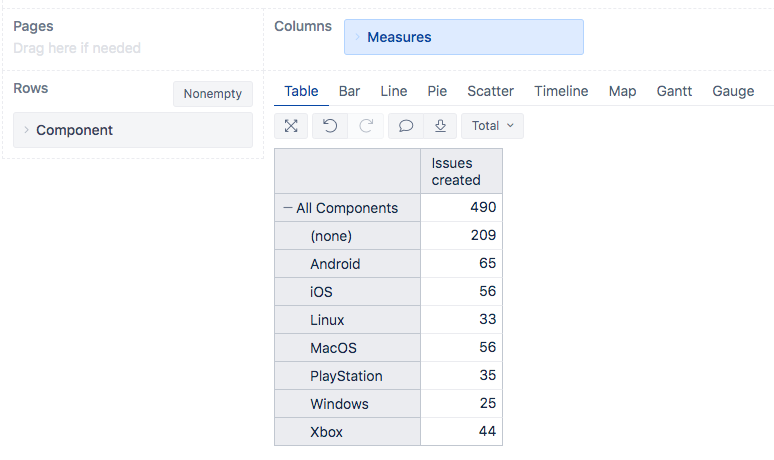
- Each of the smaller components (1, 2, 3, 4, 5) – I’ve generally got that via the Project dimension; there is some duplication when an issue is assigned multiple components
- A only (i.e., only issues that are assigned to Component A without 1, 2, or 3)
- B only (i.e., only issues that are assigned to Component B without 4 or 5)
- C only – I’ve got that via the Project dimension
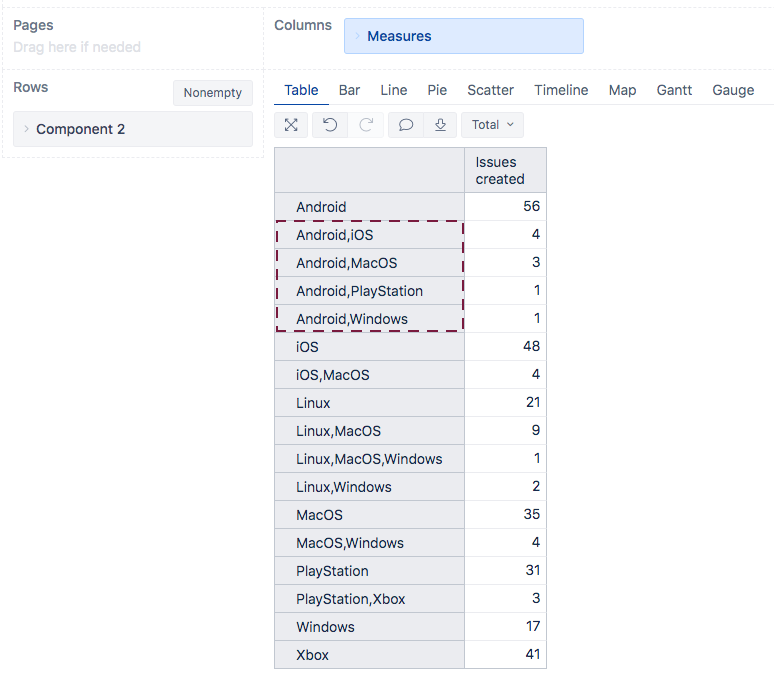
If I select just A, I get a good deal of duplication with 1, 2, and 3.
I tried creating a calculated member by starting with the entire project and then subtracting all of the small components – but I end up with negative numbers because some issues have more than one small component assigned.
Because I’m working with story points, I don’t see an existing unique count.
Any ideas?
Many thanks!