odedmo
November 21, 2019, 8:16pm
1
Hi,
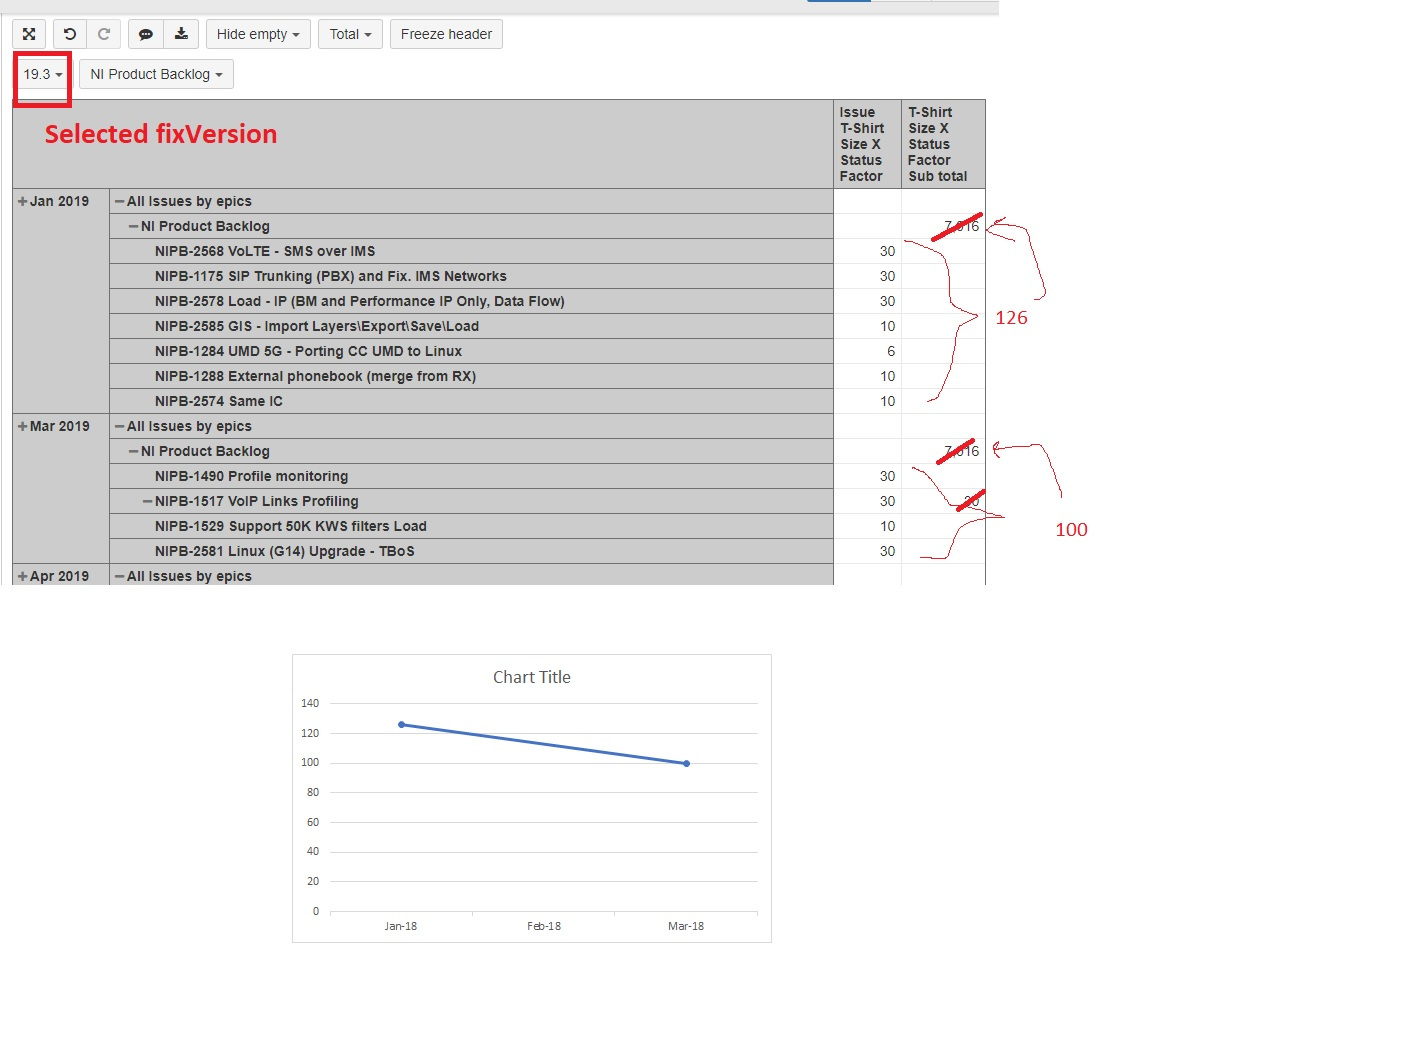
for a specific fixVersion, for every dates group (week/month), I would like to sum a customfield value:

I tried to use 2 dim table, date, issues-epics
but failed to get sub-totals by date and fixVersion
Thanks,
Hi @odedmo
You may want to import custom field “T-Shirt Size X Status Factor” as a measure. In the result, you will get a set of measures in eazyBI: T-Shirt Size X Status Factor created, T-Shirt Size X Status Factor resolved, etc https://docs.eazybi.com/display/EAZYBIJIRA/Custom+Fields#CustomFields-Totalsofcustomnumberfields
In the report, use measure “T-Shirt Size X Status Factor created ” instead of the property “Issue T-Shirt Size X Status Factor” - it will sum up the value to the project level automatically, and the value will be calculated accordingly to the selected Page filter.
Also, you may want to watch a short video about measures and properties and how they differ: https://docs.eazybi.com/display/EAZYBIJIRA/Measures+and+dimensions
Best,support@eazybi.com