Hi,
I am looking for some innovative reports in EazyBi that helps to showcase a team’s productivity. Here are some reports that I have to showcase that but loved to hear of other ideas
- Total issues created vs resolved in the same period.
- Age interval of backlog not more than 120 days
- Heatmap shows issues resolved each day of the week
Hi,
Welcome to the eazyBI community. You can get desired reports from eazyBI:
- Total issues created vs resolved in the same period.
For this report, you can use our sample report: Created vs Resolved issues over time.
https://docs.eazybi.com/eazybi/learn-more/learn-eazybi-through-sample-reports/samples-jira-issues/created-vs-resolved-issues-over-time
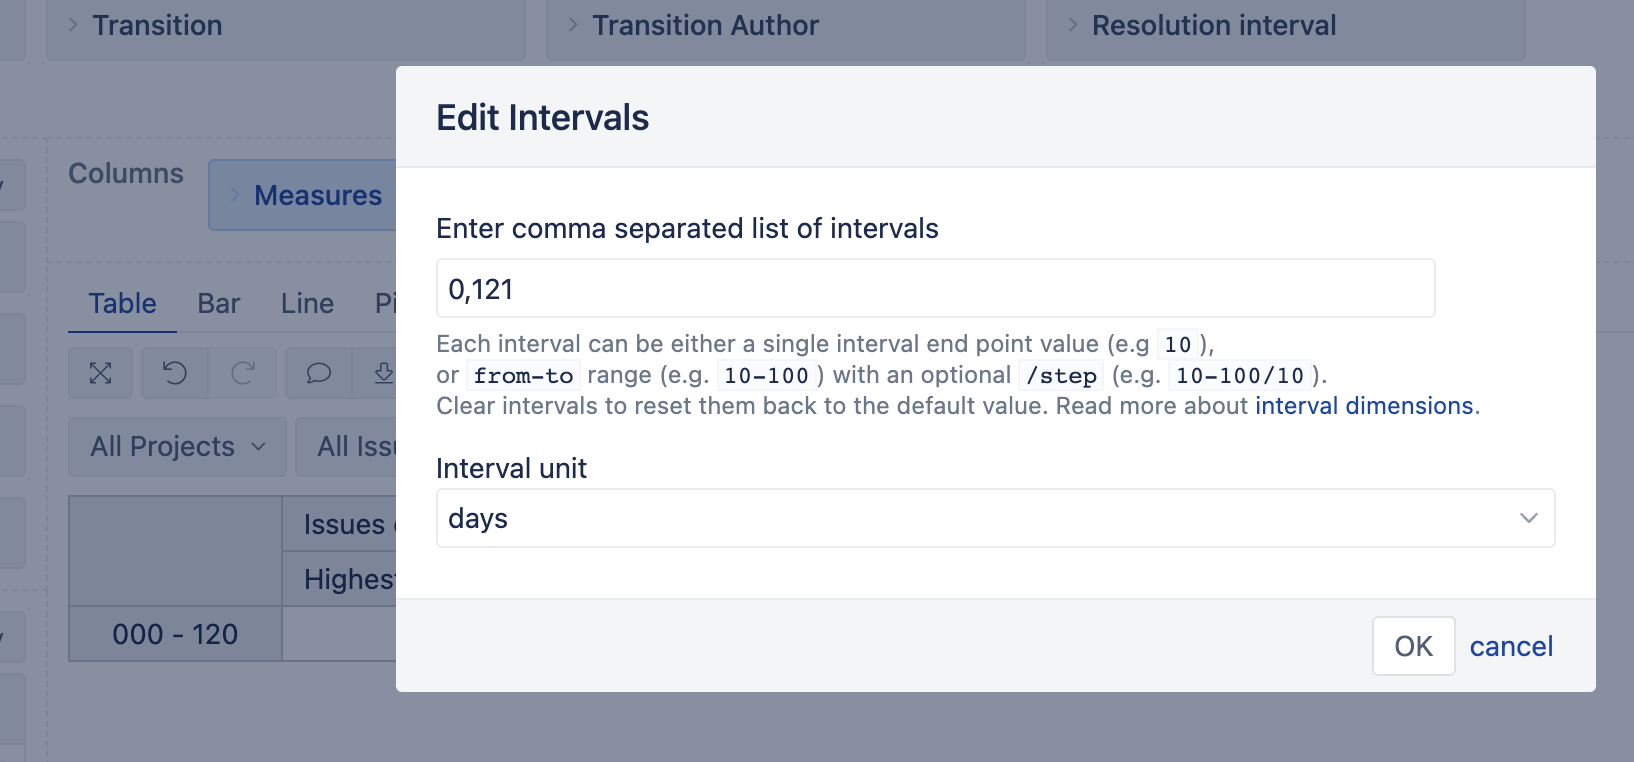
- Age interval of backlog not more than 120 days
For this report, start with our sample report: Unresolved issues by age interval and priority
https://docs.eazybi.com/eazybi/learn-more/learn-eazybi-through-sample-reports/samples-jira-issues/unresolved-issues-by-age-interval-and-priority
You can change intervals in the Age interval dimension from standard to two intervals: 0-120, and more. Then select desired interval 0-120 in the report rows.
How to change intervals you can find here: Interval dimensions
- Heatmap shows issues resolved each day of the week
We have such a heatmap report in the demo account: Most active days by weeks and weekends.
https://eazybi.com/accounts/1000/cubes/Issues/reports/499773-most-active-days-by-weeks-and-weekdays
You can export the report definition and then import it into your account. How to do that you can find here: Export and import report definitions
If you want to learn how to create a heatmap using conditional cell formatting find it here:
https://docs.eazybi.com/eazybi/analyze-and-visualize/create-reports/conditional-cell-formatting#Conditionalcellformatting-Heatmap
Kind regards,
Ilze Mezite, support@eazybi.com
Thanks for responding.
I already have these reports. My question was to find out if there are other reports that I can generate that can show my team’s productivity.
Hi,
Great that you have those reports already created.
For more inspiration and ideas you can check eazyBI DEMO account where are a lot of reports collected: Demo accounts
Reports are grouped in dashboards by themes.
You can export definitions of those reports you are interested in and import them into your account:
Export and import report definitions
Best regards,
Ilze M