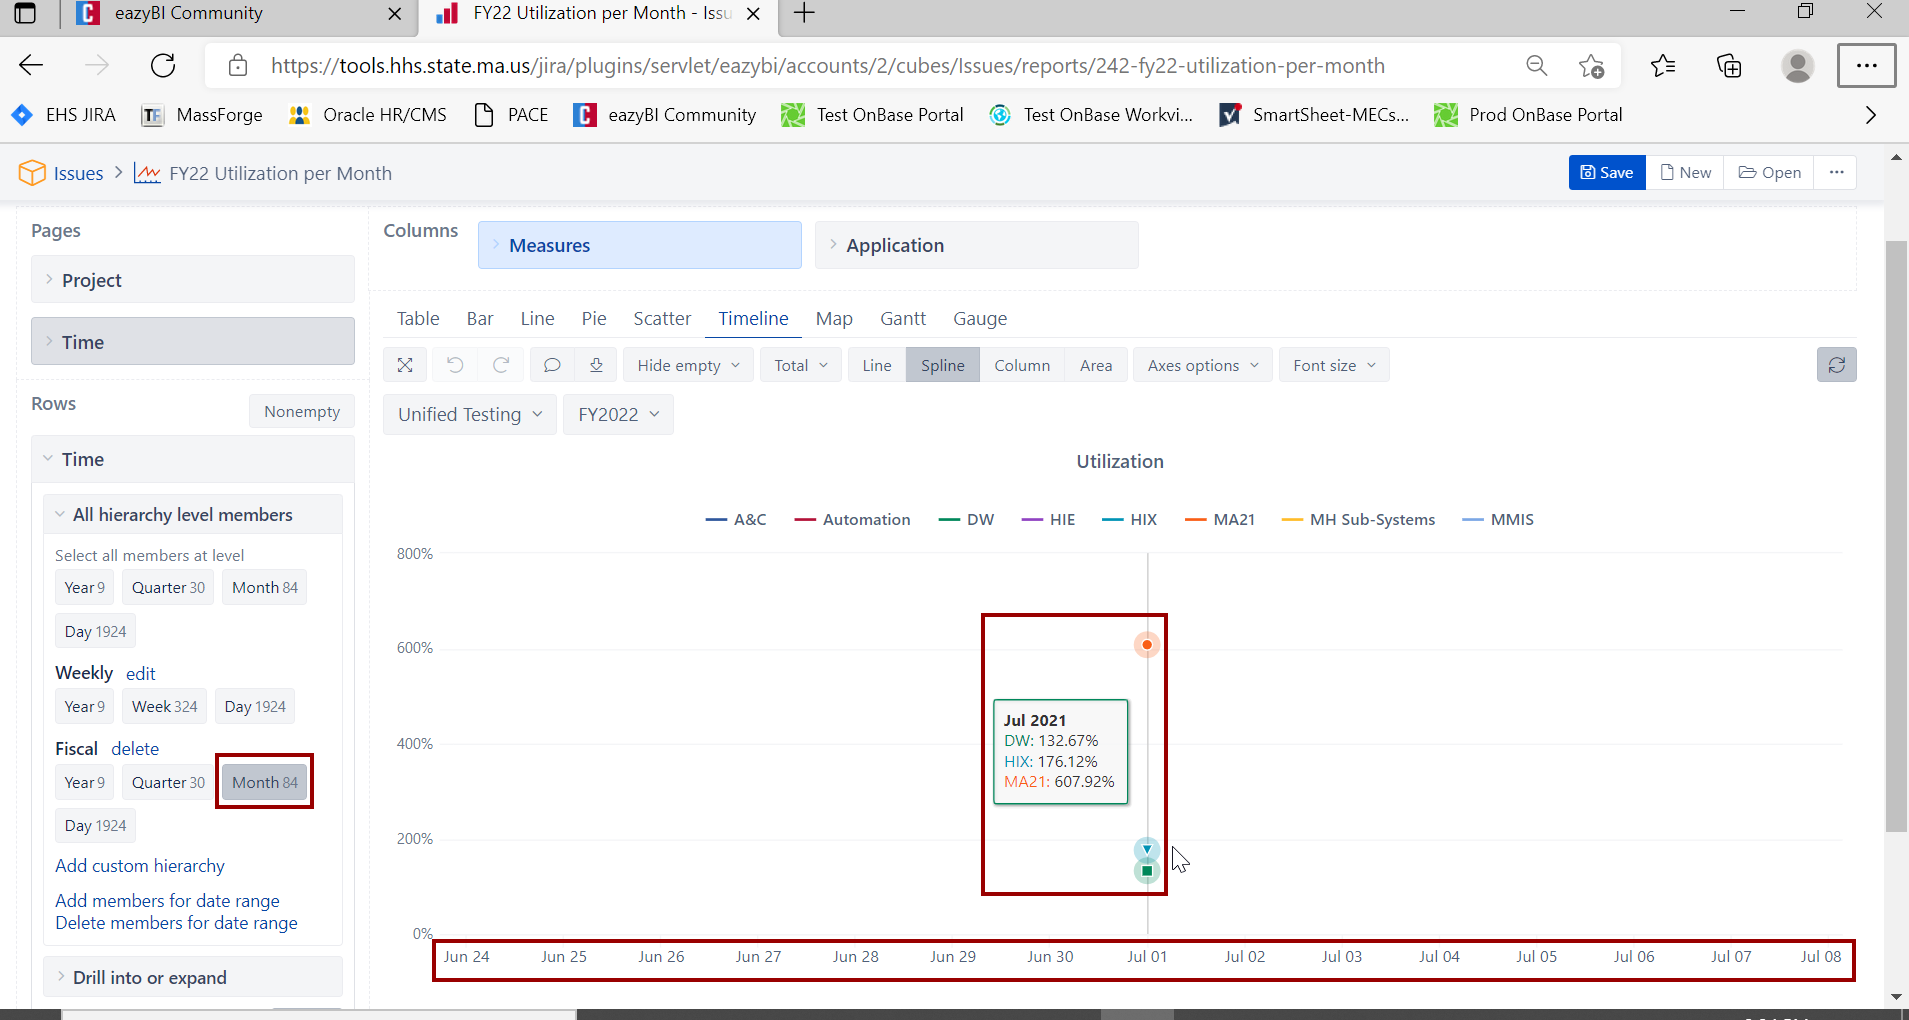
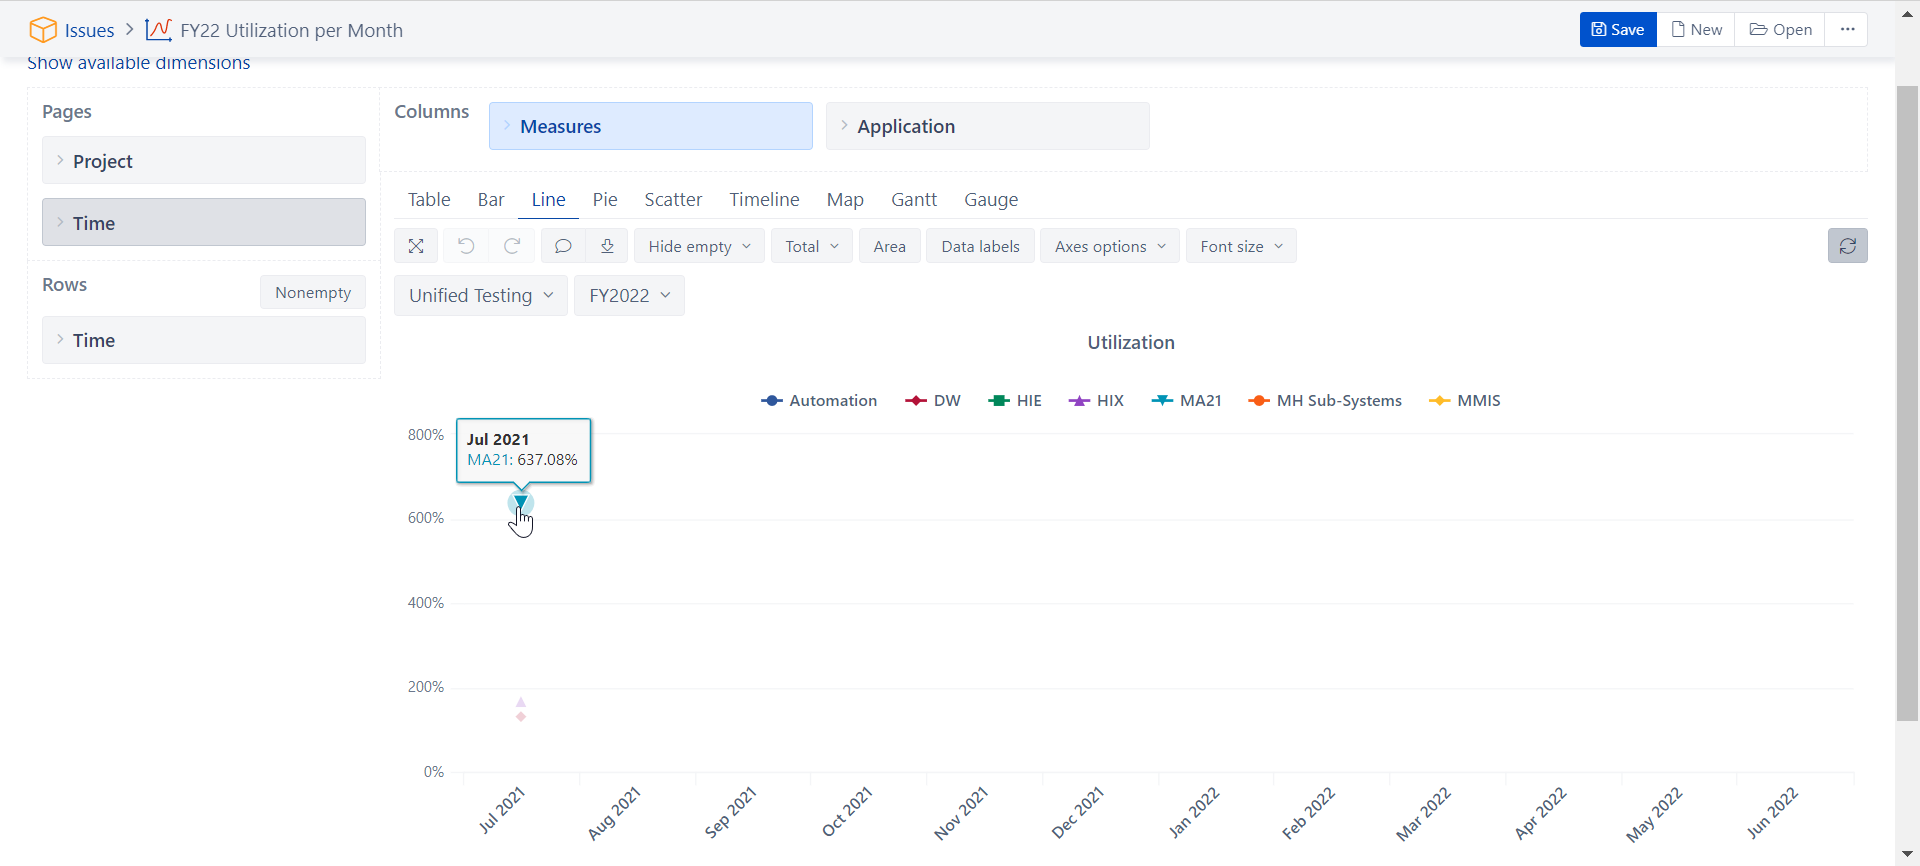
I’ve created a timeline report specifically for a defined fiscal year 2022 (July 2021 to June 2022) at a monthly display but the report shows a daily display and I can’t seem to figure out why. Also if I hover over the first data point it does correctly provide the July 2021 month data. (I will need to review the measures behind that data though as it is not correct). Can anyone provide any insight please?
Hi @Alyssa_A,
The Timeline chart displays dynamic dates on the x-axis. This is especially useful when you look at the day level and there are very many days and labels become unreadable.
The data points are still grouped by the specified level.
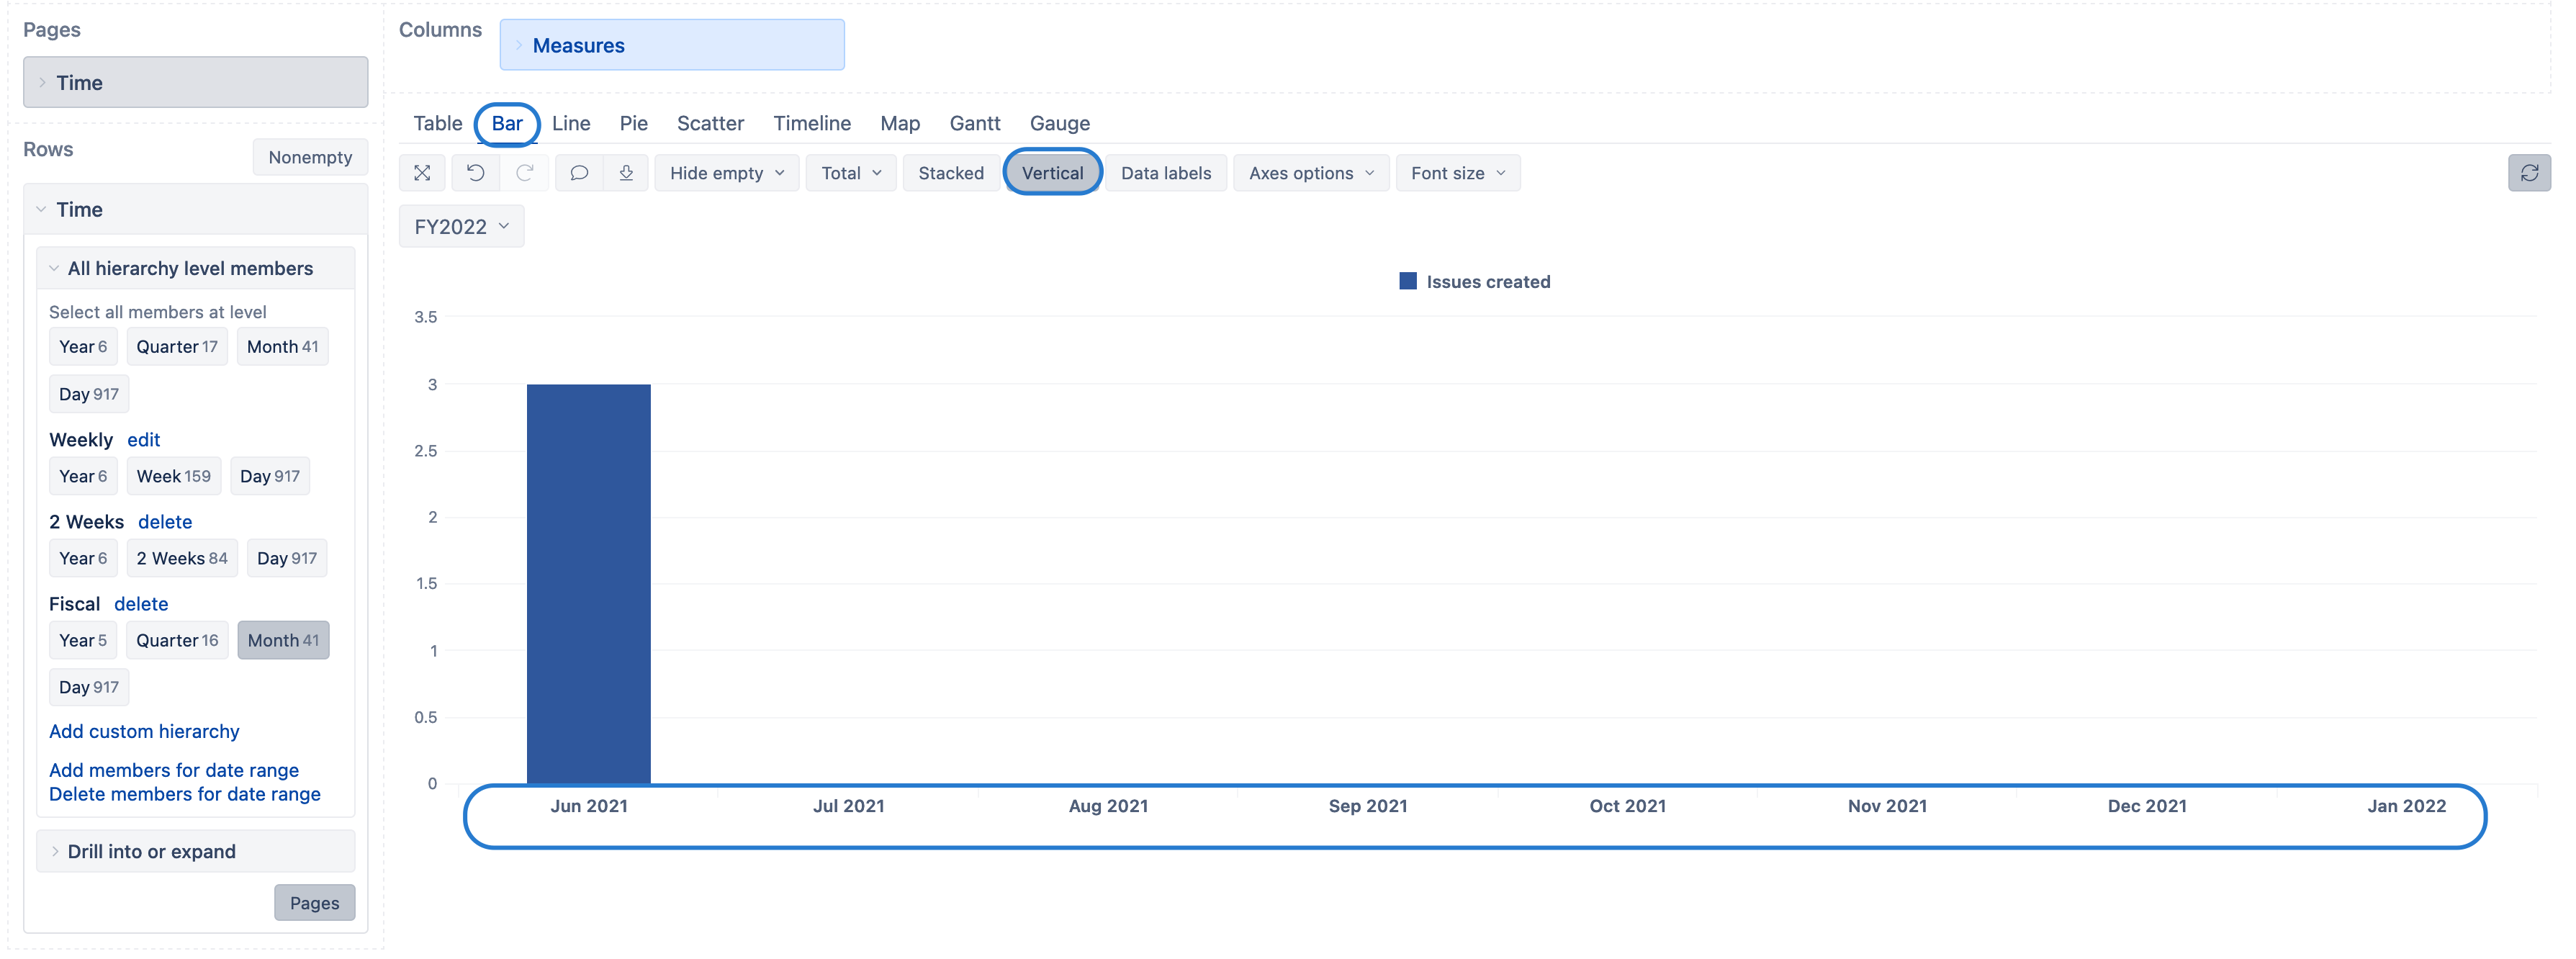
If you wish to see the exact month name on the x-axis, use the Bar or Line chart instead:
Lauma / support@eazybi.com
I’m getting a bit confused on the timeline vs. the table/bar/line options. I was able to previously create a fiscal year 2021 report using the timeline format but I’m unsuccessful for fiscal year 2022. If I alter either the fiscal 2021 or 2022 to the table/bar/line formats the same measures are not calculating correctly.
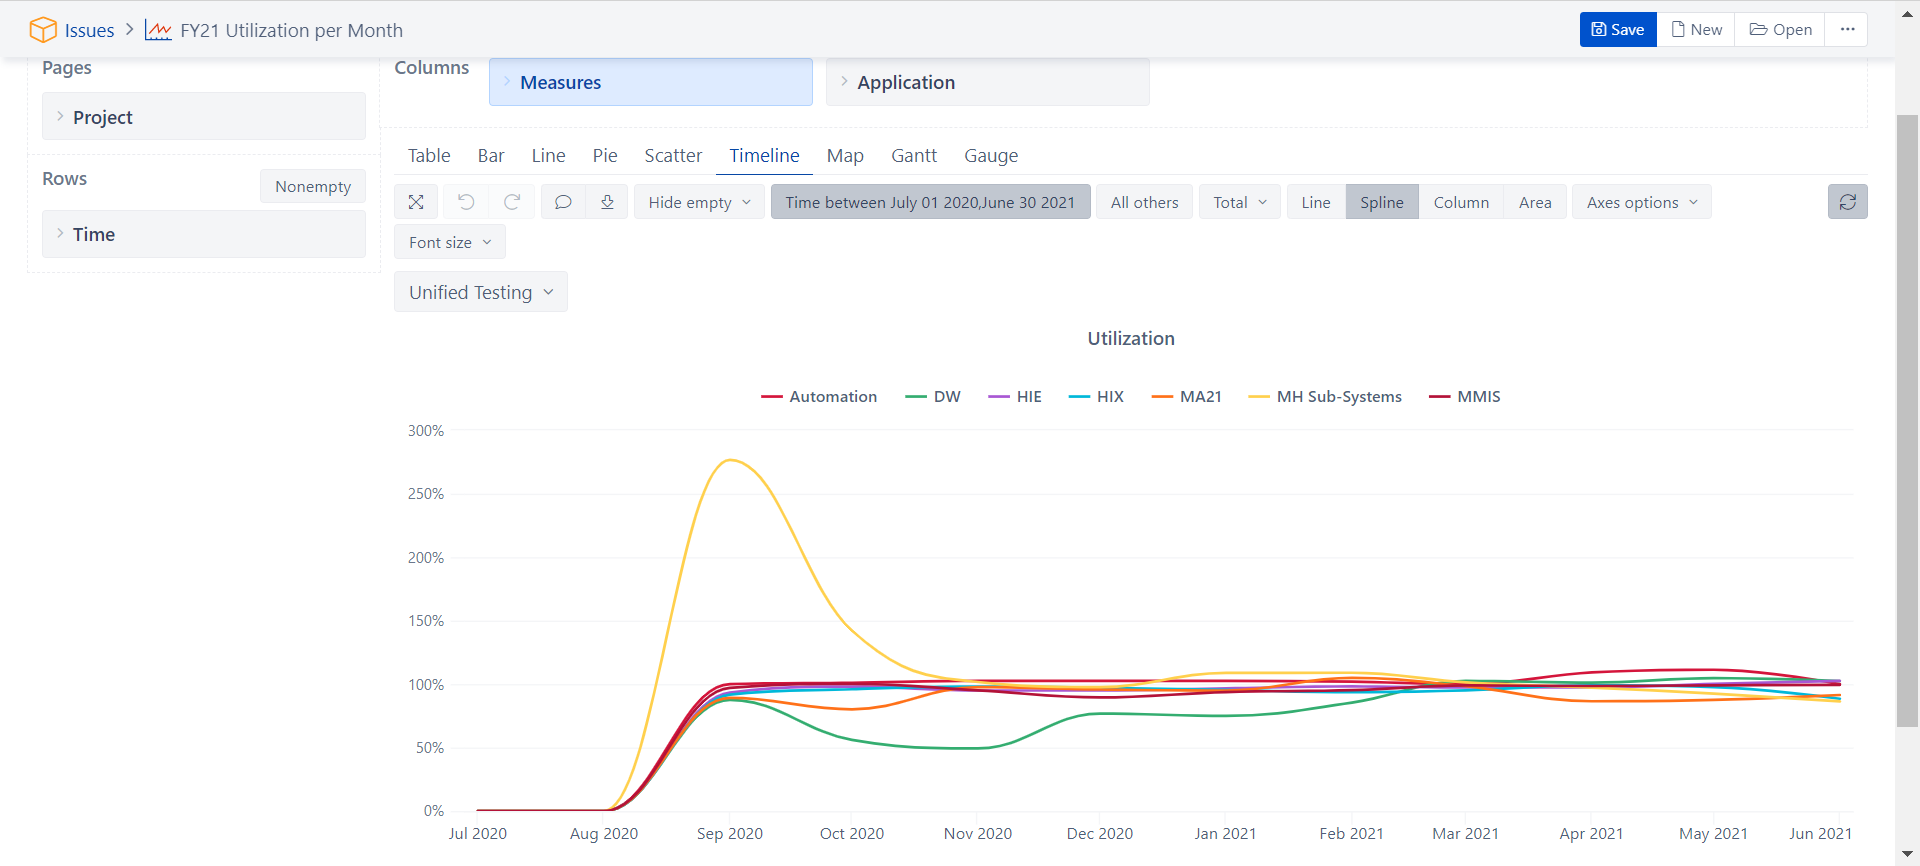
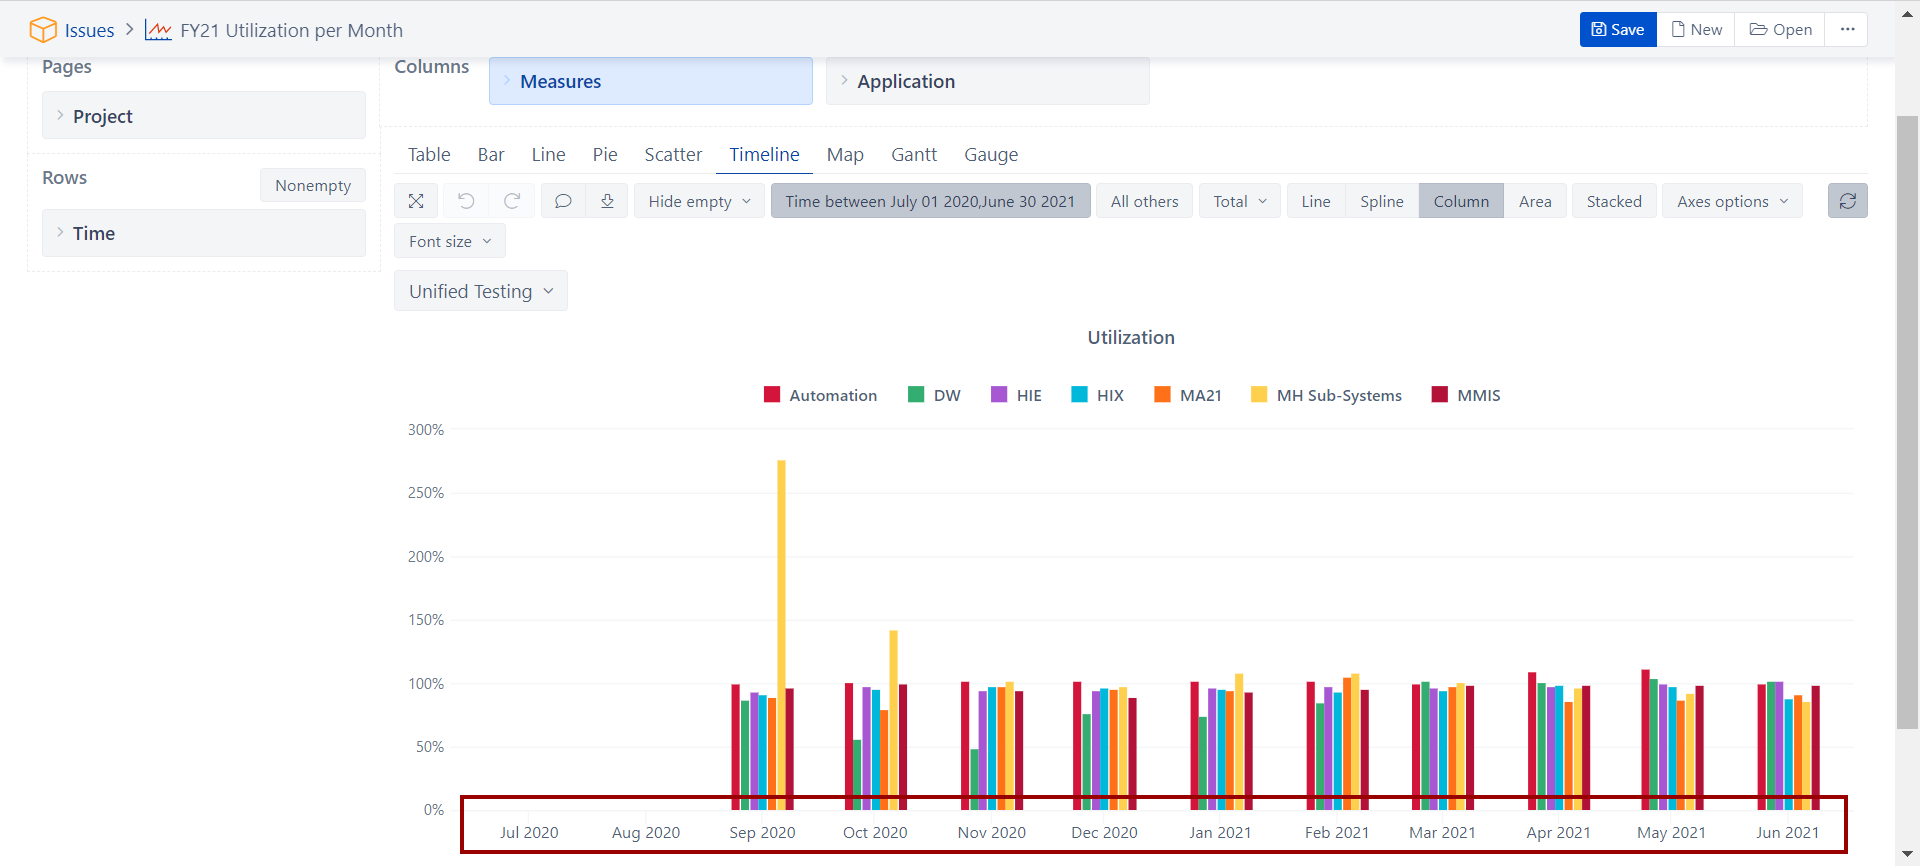
Below is the fiscal 2021 timeline report with the ‘Utilization’ measure calculating correctly.
Below is the fiscal 2021 table report with the ‘Utilization’ measure calculating incorrectly.
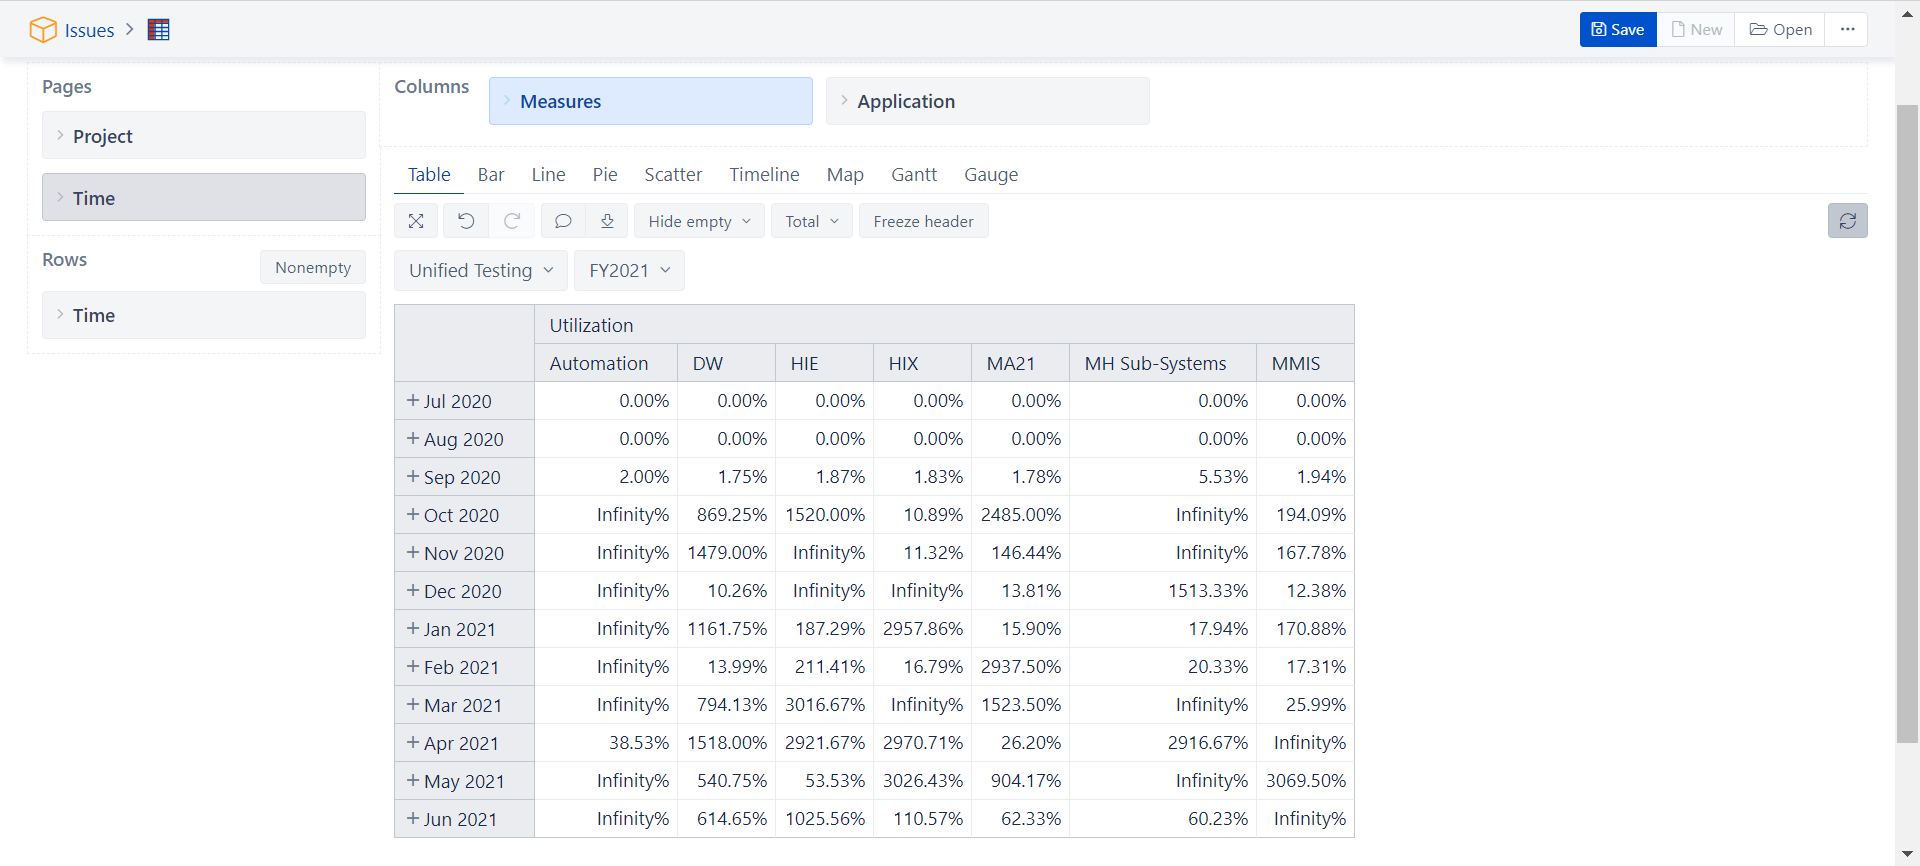
Is this because I’m filtering the dates/months in two different ways? The measure calculates incorrectly for fiscal 2022.
Utilization Measure is the following:
CASE WHEN
DateCompare(
[Time].CurrentHierarchyMember.StartDate,
now()
) < 0
THEN
CASE WHEN
[Time].CurrentHierarchyMember.Level.name = “Day”
THEN
Val([Measures].[Utilization Calc]/([Measures].[Day Count]))
ELSE
Val(sum(
Filter(Descendants([Time].CurrentHierarchyMember, [Time].[Day]),
[Measures].[Utilization Calc]>0
),
[Measures].[Utilization Calc])/([Measures].[Day Count]))
END
END
Utilization Calc Measure is the following:
CASE WHEN
DateCompare(
[Time].CurrentHierarchyMember.StartDate,
now()
) < 0
THEN
NonZero(Sum(Filter(
Descendants([Transition Status].CurrentHierarchyMember,[Transition Status].[Transition Status]),
NOT IsEmpty([Measures].[Issues history])
),
CASE
WHEN [Transition Status].CurrentHierarchyMember.Name = “In Progress” OR
[Transition Status].CurrentHierarchyMember.Name = “At Risk”
THEN
[Measures].[Resource #1 % Allocated history]+
[Measures].[Resource #2 % Allocated history]+
[Measures].[Resource #3 % Allocated history]+
[Measures].[Resource #4 % Allocated history]+
[Measures].[Resource #5 % Allocated history]+
[Measures].[Resource #6 % Allocated history]+
[Measures].[Resource #7 % Allocated history]+
[Measures].[Resource #8 % Allocated history]+
[Measures].[Resource #9 % Allocated history]+
[Measures].[Resource #10 % Allocated history]
WHEN [Transition Status].CurrentHierarchyMember.Name = “Completed” AND
(
[Measures].[Issues history],
[Resolution].[Completed]
) > 0
THEN
[Measures].[Resource #1 % Allocated change]+
[Measures].[Resource #2 % Allocated change]+
[Measures].[Resource #3 % Allocated change]+
[Measures].[Resource #4 % Allocated change]+
[Measures].[Resource #5 % Allocated change]+
[Measures].[Resource #6 % Allocated change]+
[Measures].[Resource #7 % Allocated change]+
[Measures].[Resource #8 % Allocated change]+
[Measures].[Resource #9 % Allocated change]+
[Measures].[Resource #10 % Allocated change]
END
)) / 100 /
CASE
WHEN [Application].CurrentMember.Name MATCHES “A&C” THEN 3
WHEN [Application].CurrentMember.Name MATCHES “Automation” THEN 4
WHEN [Application].CurrentMember.Name MATCHES “DW” THEN 4
WHEN [Application].CurrentMember.Name MATCHES “HIE” THEN 3
WHEN [Application].CurrentMember.Name MATCHES “HIX” THEN 7
WHEN [Application].CurrentMember.Name MATCHES “MA21” THEN 4
WHEN [Application].CurrentMember.Name MATCHES “MH Sub-Systems” THEN 1.5
WHEN [Application].CurrentMember.Name MATCHES “MMIS” THEN 10
END
END
Hi @Alyssa_A,
Thank you for the screenshots and formula! For the fiscal year 2022, there is only one month with data for now - besides July, the other months are in the future. So currently you only have one data point for each application in July. As soon as there will be data for August, the lines will start drawing.
Let me know if I missed something and you have some further questions!
Lauma / support@eazybi.com
Can you explain to me why I can get all months displaying in x axis for my fiscal year 2021 report but not my fiscal year 2022 when using the same measures, columns, pages and rows? Is this because I only have one data point so far for fiscal year 2022?

Yes, that is the reason. If there are no data, the Timeline still dynamically draws some time before and after the data point, showing some dynamic labels - if there are no data, then the day is the lowest level appended to both sides.
To show the same aggregated time periods (Fiscal year months) even if they are empty, please choose the Bar or Line chart.
Lauma / support@eazybi.com