Hello community,
I have imported JIRA source data based on JQL,
Result A : project = P1 and issuetype in (T1, T2, T3)
Result B : project = P2 and issuetype in (T4, T5)
Result C : project = P3 and issuetype in (T5, T6)
Question 1 :
I want to know first what I’m going to use as dimenions in columns and rows ?
Question 2 :
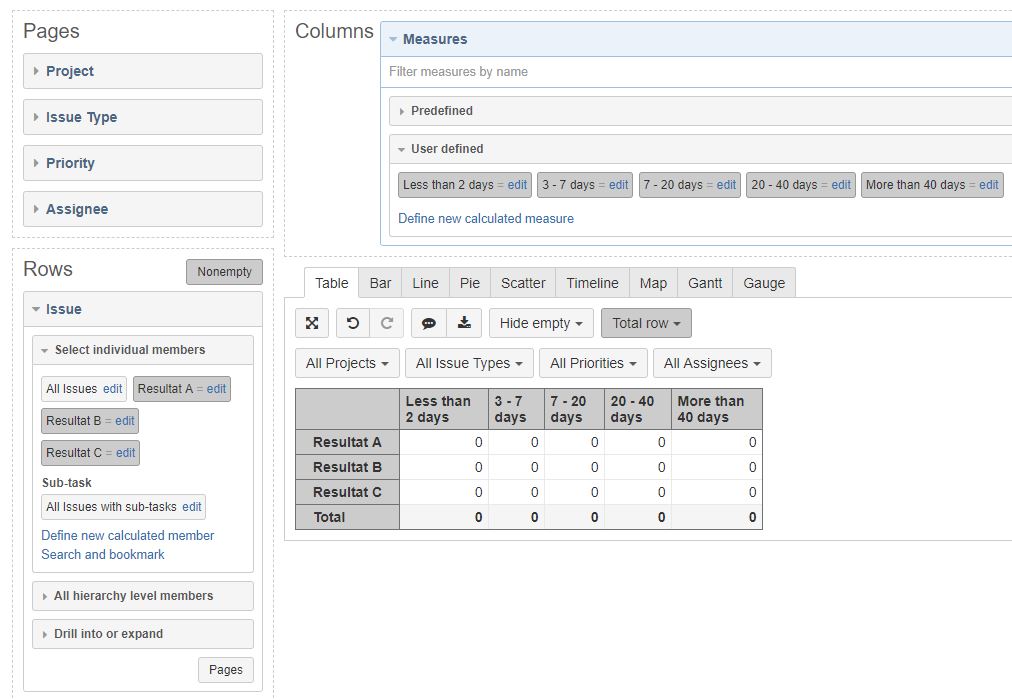
I tried to put in columns the dimension [Measures]. For example, for the column « 3 – 7 days », i tried to create a new calculated measure as follows :
" 3 – 7 days :"
Count(
Filter(
Descendants([Issue].CurrentMember, [Issue].[Issue]),
DateDiffDays([Measures].[Issue created date], Now()) >= 3
AND
DateDiffDays([Measures].[Issue created date], Now()) <= 7
))
And in the rows i used the dimension [Issue] with the calculated member
« Resultat A » for example using the following code :
CASE
WHEN [Issue].[Project].Name = ‘P1’
THEN
Count(
Filter(
Descendants([Issue].CurrentMember, [Issue].[Issue]),
[Issue].CurrentHierarchyMember.GetString(‘issuetype’) = “T1|T2|T3”
))
END
But my calculated measure and member are not displaying what I want.
Besides, if the result is empty I want show either 0 or an empty cell (i.e the colum must be displayed even if all its cells are 0 or empty)
Can you please help me on this?