Hi, community,
Asking for your help. I can’t create a simple report at first glance. The report needs to show the date and time when the issue was in one status and switched to another (Status A → Status B and etc.). The report itself will be uploaded to a CSV file and used in the CRM system.
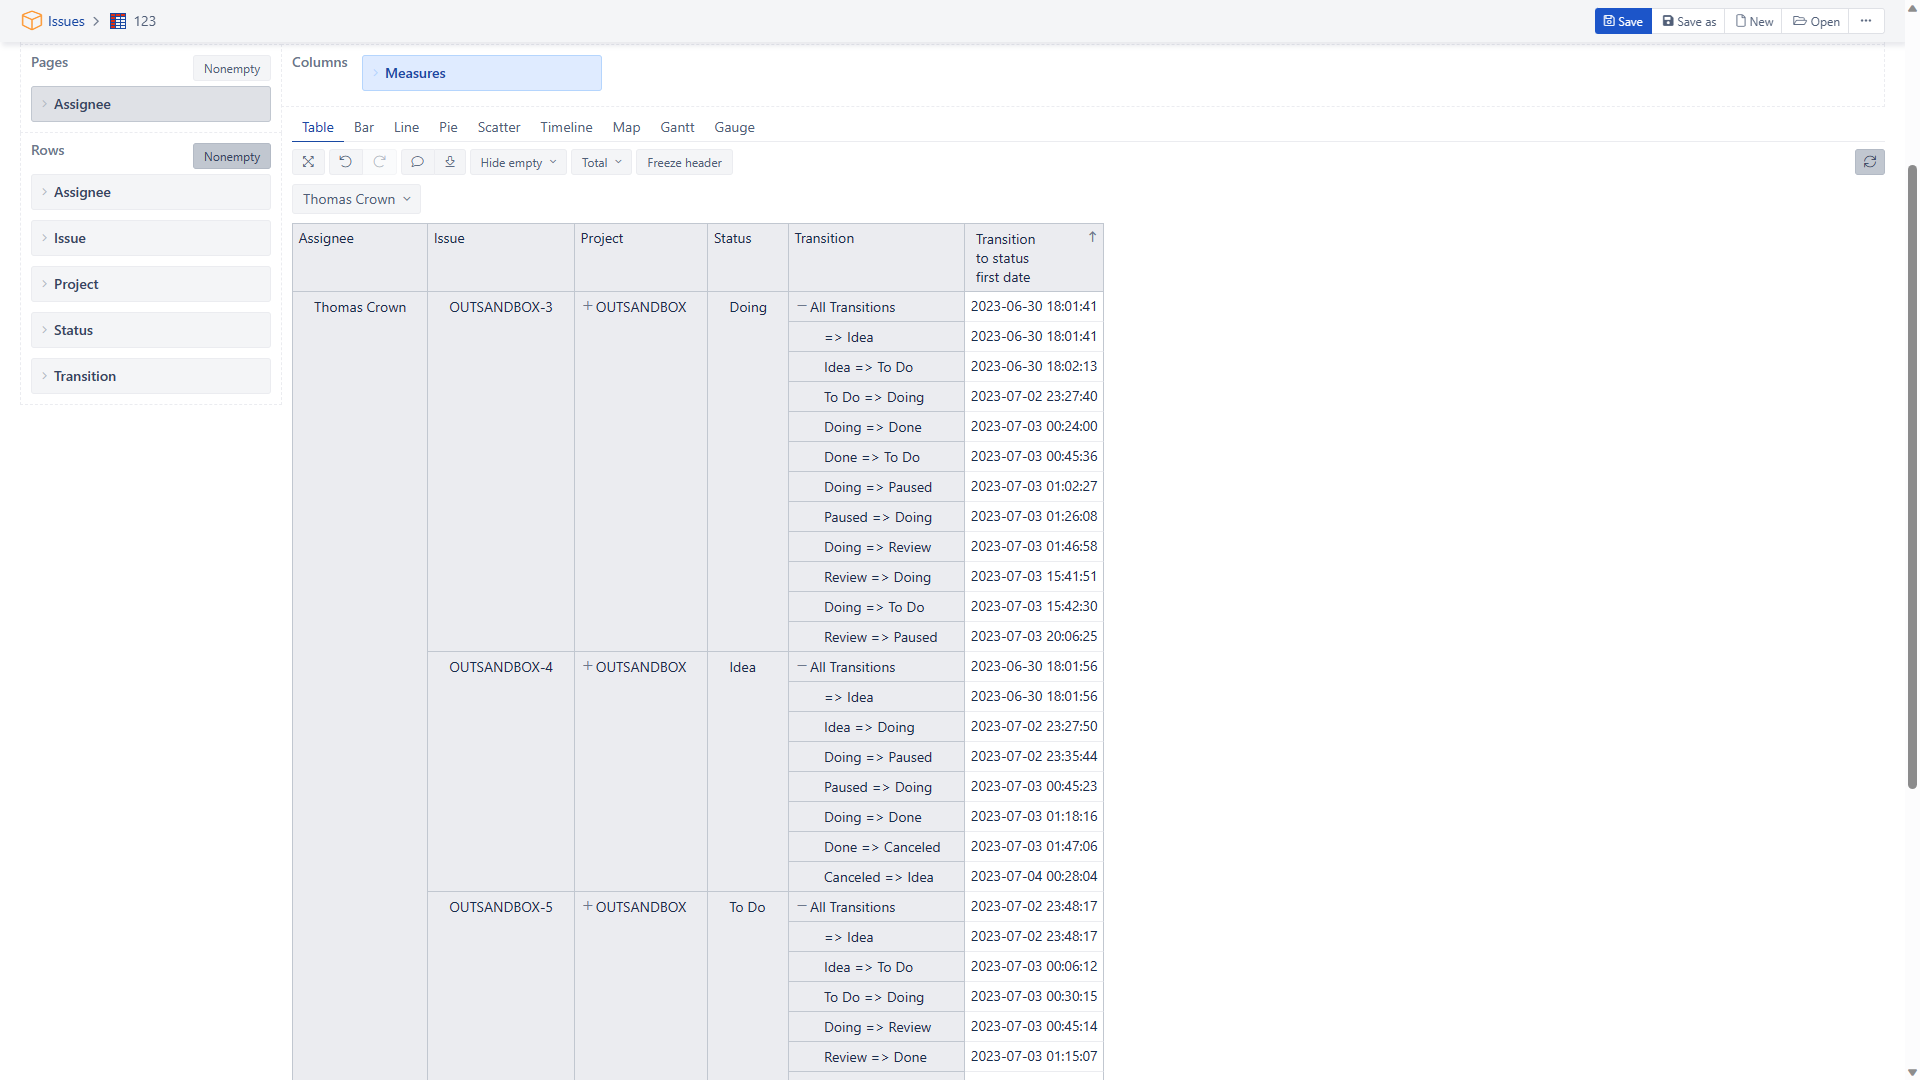
Here’s what I did:
As you can see, I need the columns: Assignee; Issue; Epic (not added yet); Project; Status (current status of the issue); Date and Time when the issue was in Status A and moved to the next status by workflow (like To Do → Doing); Issue due date (I know how to do this).
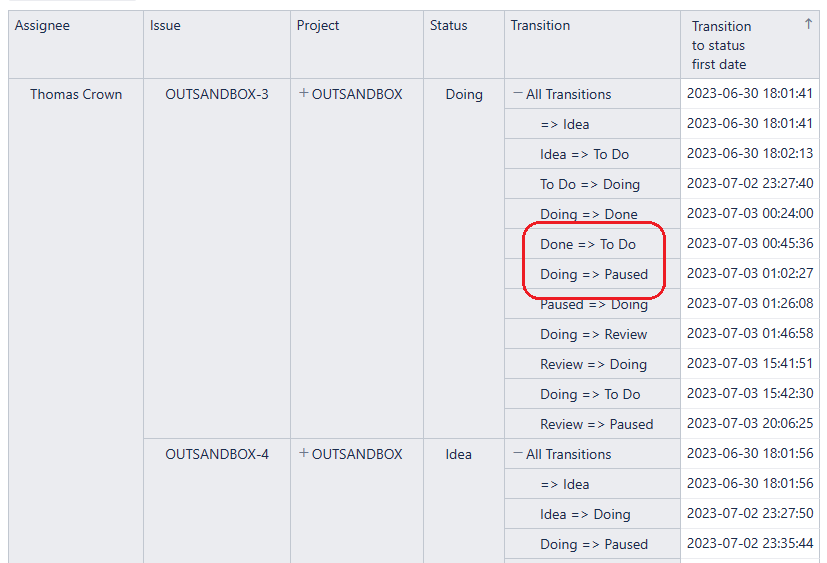
The main problem is that my report doesn’t show all the history of transitions between statuses. This report is fine for me, and I see in it from what status to what status the transition was made and when this transition was made. But again, the problem is that not all transitions are shown here.
I can’t figure out how to do a proper extraction. Can you tell me how to correct my report, or maybe someone has a better solution than what I did?
PS. The report is simple and made with basic features.
Hi @th.crown,
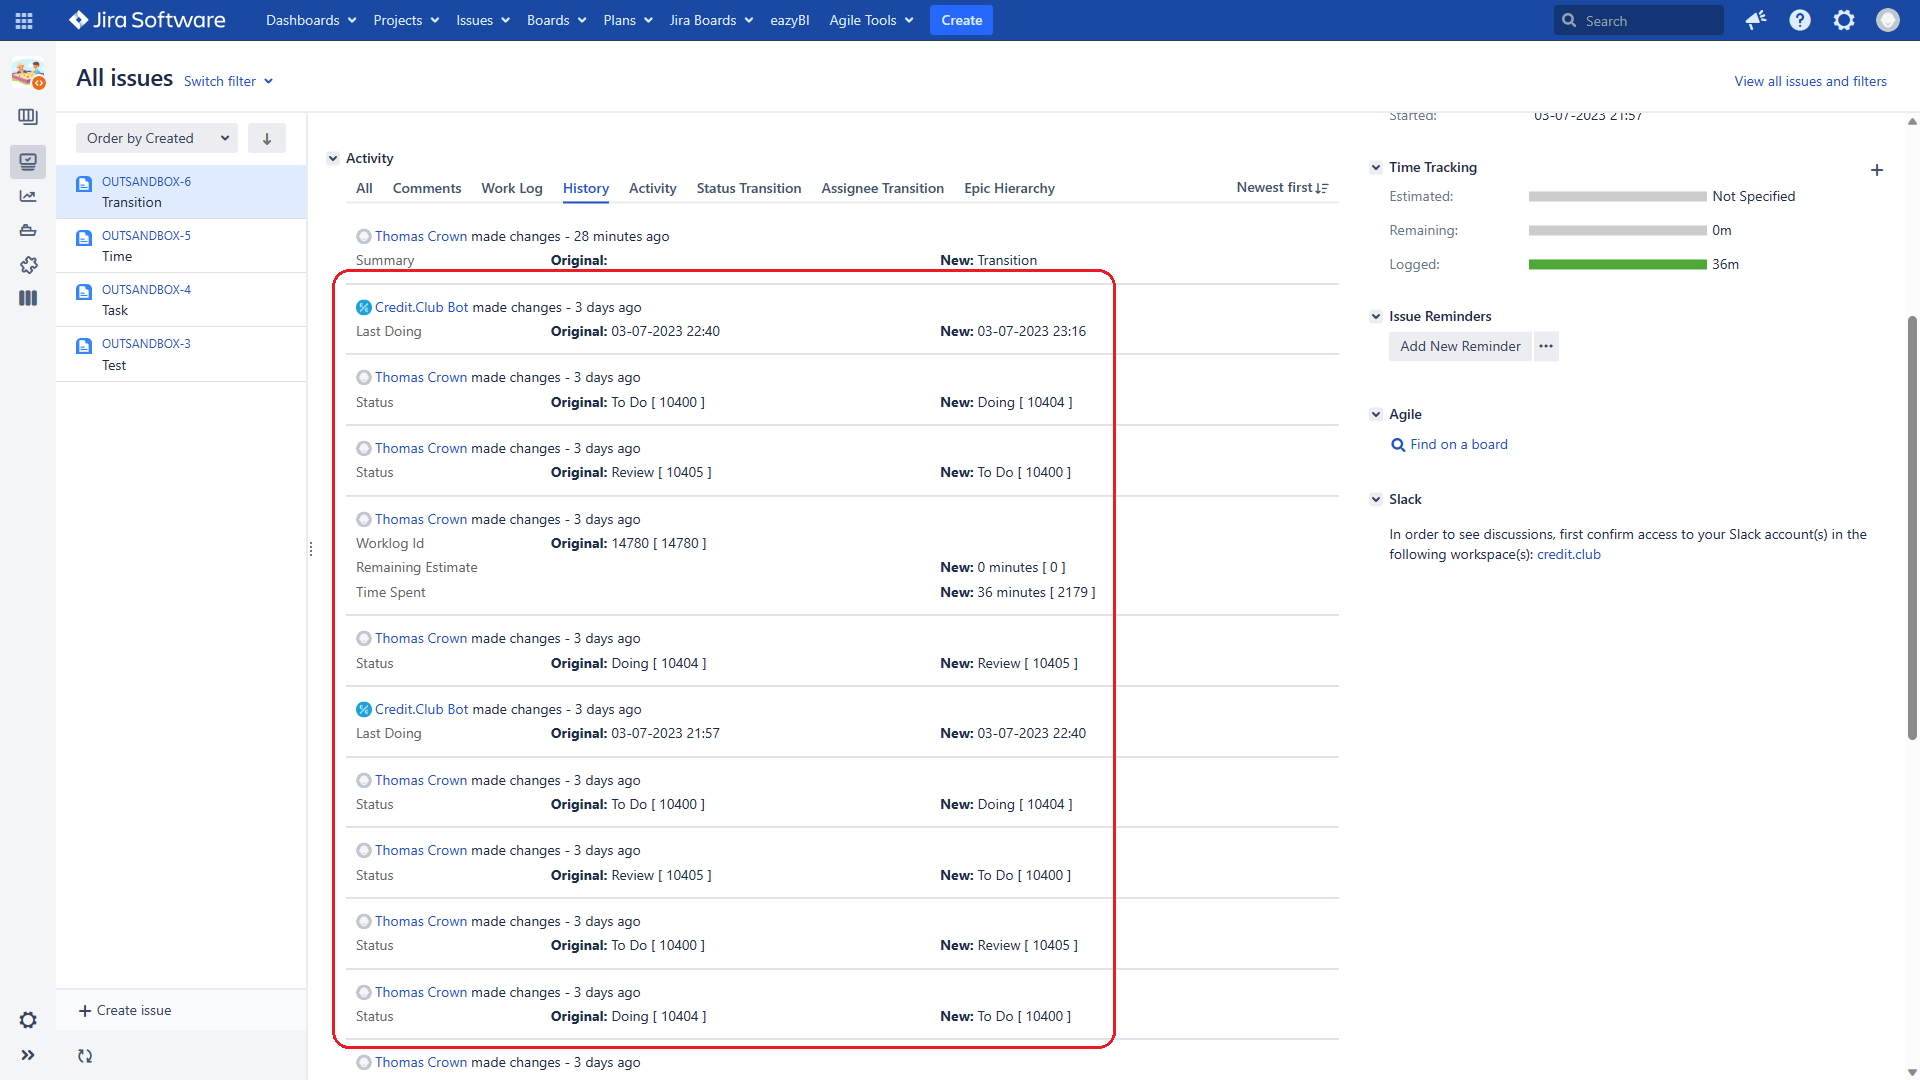
eazyBI registers the first and the last date of the transition in the measures “Transition to status first date” and “Transition to status last date”. These two measures are also tied to the Time dimension. That means that eazyBI can return two dates for each day there were transitions. If, in a single day, the issue had more than two same transitions, unfortunately, the eazyBI won’t return the middle dates.
First, I recommend using only the Issue and Transition dimensions in the report rows. Replace the rest with issue properties “Issue assignee”, “Issue status”, and “Issue Epic Link”. Next, add the “Transitions to status” measure to view the total number of transitions. Finally, define a new calculated measure with the formula below:
-- only one transition in total
CASE WHEN [Measures].[Transitions to status] = 1
THEN
Format([Measures].[Transition to status first date],'yyyy-mm-dd hh:nn:ss')
-- two transitions in total
WHEN [Measures].[Transitions to status] = 2
THEN
Format([Measures].[Transition to status first date],'yyyy-mm-dd hh:nn:ss')
|| "<br>" ||
Format([Measures].[Transition to status last date],'yyyy-mm-dd hh:nn:ss')
-- more than two transitions in total
ELSE
Generate(
  Filter(
    Descendants([Time].CurrentMember,[Time].[Day]),
    [Measures].[Transitions to status] > 0
  ),
  -- one transition in particular day
  CASE WHEN [Measures].[Transitions to status] = 1
  THEN
  Format([Measures].[Transition to status first date], 'yyyy-mm-dd hh:nn:ss')
  -- more than one transition in a day - only the first and last will be returned
  ELSE
  Format([Measures].[Transition to status first date],'yyyy-mm-dd hh:nn:ss')
  || "<br>" ||
  Format([Measures].[Transition to status last date],'yyyy-mm-dd hh:nn:ss')
  END,  "<br>"
)
END
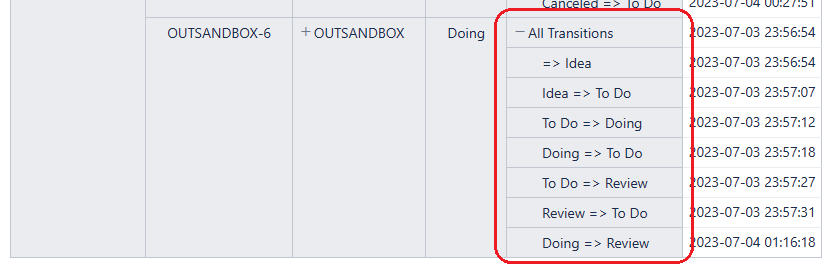
Use the “Markdown” formatting for the calculated measure. The report could look similar to the one below:
Please look at our documentation page for more information on defining calculated measures - Calculated measures and members.
Best,
Roberts // support@eazybi.com