Looking for some assistance in building out a report (sourcing JIRA data) where it takes all of the currently open issues, and then groups them by the year they were created so that we can see how many open issues remain that were created in X, Y, Z years. I tried doing this by selecting the “Open Issues” and “Issue created date” measures that pre-existed, and then put Time in Rows and selected the Years under all hierarchy level members. Unfortunately, it ends up displaying all issues created in that year and all years before it (i.e. 2015 gives 15, and then 2016 gives 100+15, and then 2017 gives 200+100+15). This results in an inaccurate representation of only those issues created in that year. Let me know if I can elaborate any further, and thanks in advance for any assistance.
The measure “Open issues” cumulatively sums all open issues. With the Time dimension in the report, it will add the number of open issues from the previous period to the next one.
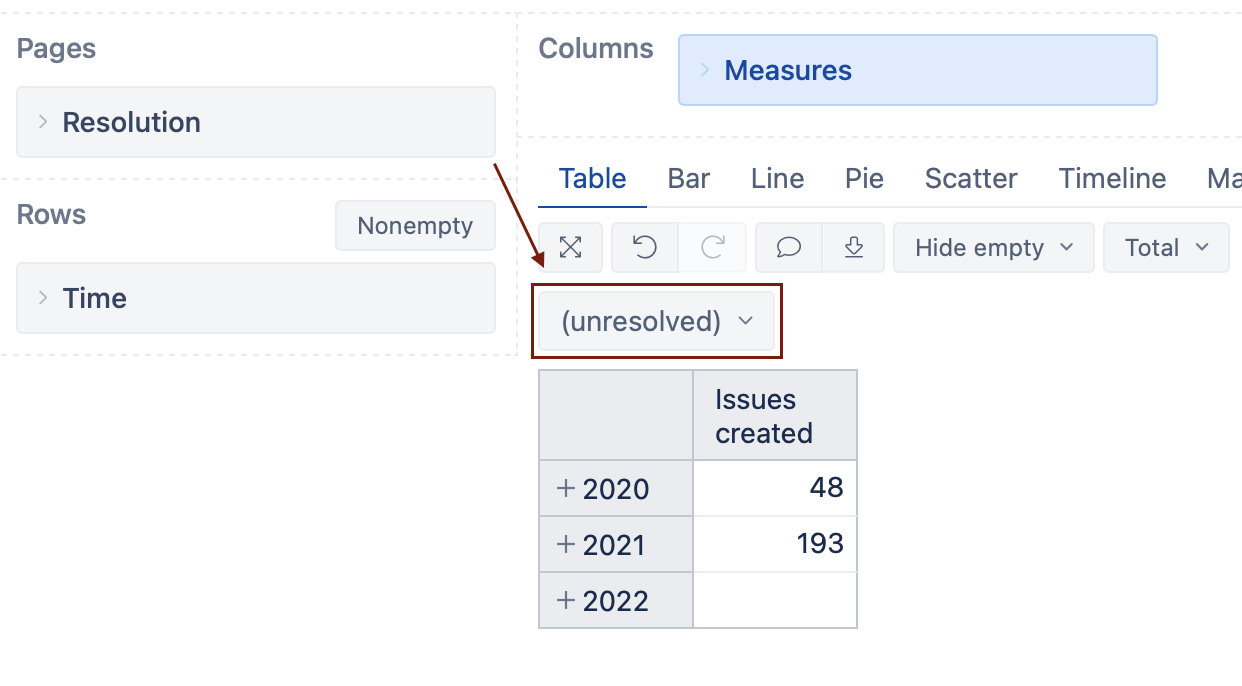
To view the unresolved issues by their creation date, I recommend using the measure “Issues created” instead and adding the Resolution dimension to the report pages. There you can filer the report to return only unresolved issues. See a screenshot of the suggested report below: