Hello, I have the following view in eazybi and I would like to be able to view the full name of the issue that is being displayed, is there an option?
Hi @Marcelo_Ignacio_Cid1,
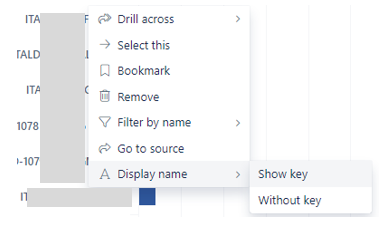
on the chart click on ticket full name and then display name > Show key

Hello @DamianoDB
thanks for answering.
Even though I remove the key from the broadcast, it still cuts off the name of the broadcast. is there another option?
Hi @Marcelo_Ignacio_Cid1 ,
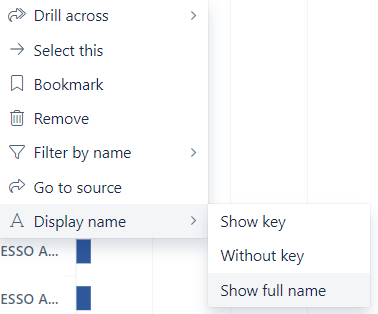
you should have the following option (Show full name) to display the full name

Thank you very much, I don’t know why I didn’t see it before.
@DamianoDB Sorry for bothering you again about this request.
I had two more questions:
- It is possible to determine the range of dates displayed: Ex: group by weeks, months or Q
- Is it possible to widen the bar a little more? (Thicker)
That depends on the chart format. In your case, it seems you use the “Bar” chart as a range with particular issue date properties. You can’t change the date range in this configuration, as the chart calculates it dynamically. You can do that in other chart configurations with the Time dimension in report rows.
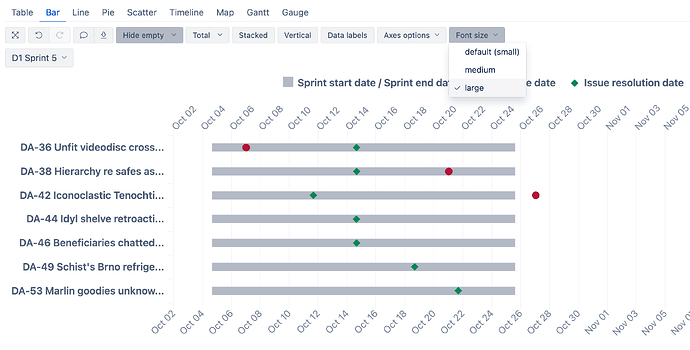
The bar thickness is determined dynamically by the chart, depending on the orientation (horizontal/vertical) and the number of items. You can increase the font size, which will thicken the bar charts as well:
Best,
Roberts // support@eazybi.com
Thank you very much for the help, my question was the following, is there the possibility of modifying the date range that appears at the bottom, for example: setting the view by month instead of by day like you have? This is because sometimes I have final dates like October 30 that in the macro view appear to me to last until November and this generates doubts when submitting the report. I know there is the option to zoom in on the dates but it is not what I am looking for.
The answer to your question depends on the chart type you have chosen. In the bar chart with issue date properties, the data view is not customizable - it is calculated dynamically based on the dates in the report.
You can control the date view in the Gantt chart, but doing so removes other indicators and allows you to keep only the range - Create charts.
Best,
Roberts // support@eazybi.com
I have realized that, nothing more to do.
Thank you very much for the help.

