Add burn down baseline to Issue history graph

Hello all,

I am looking to build a burn down chart report that displays count of open and closed issues and NOT story points. The requirements are:

  1. Needs to be independent of sprints (issues are not necessarily in a sprint or are spread over many sprints)
  2. Start and End date can be set manually in eazyBi (by creating a measure for example)

I am struggling to add the baseline with my current setting (using as columns [Measures].[Issues history] and [Transition Status].

Any idea how I can add this manually parametrized baseline?

Hi @ena ,
Here is one demo report that you could find helpful: Open Issues Trend - Issues - Jira Demo - eazyBI
It has example of ideal burn-down, burndown from today and s-curve predictions.

Best,
Gerda // support@eazybi.com

Hi @gerda.grantina
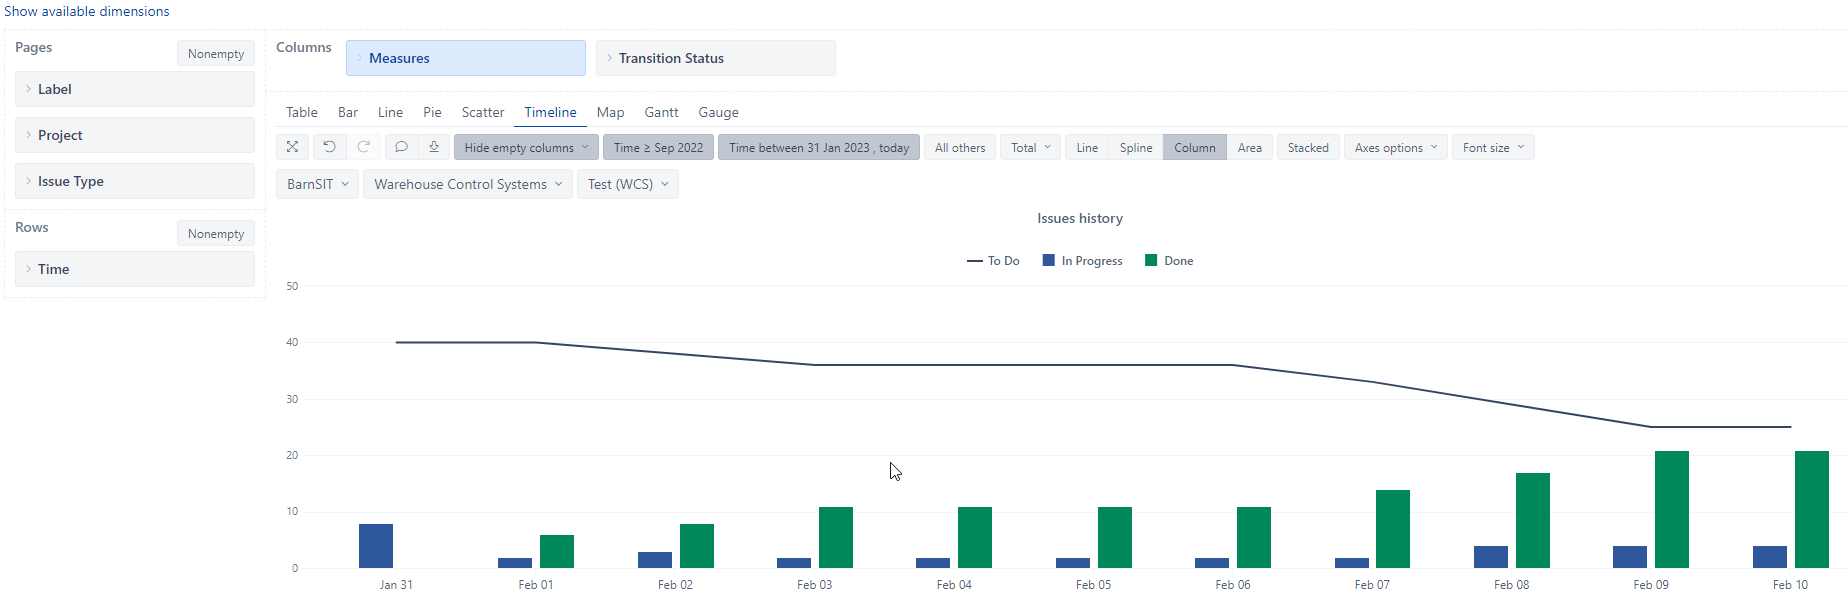
I exported this report and imported in my project. After selecting my project I got a similar result but the report ends “today” and not as defined in [Measures].[report end date]. Any idea how to fix?

Hi @ena,
By default, eazyBI is adding members to the Time dimension only if there is some activity on that date. Future dates often are not added as the only action that usually is in the future is the Issue due dates or Sprint end date. Nevertheless, if you would like to add projection in the future or fill in gaps for the past, you can add members to the Time dimension manually.
See details here: Time dimension.

Or you can adjust import options and add date members for future date range automatically during data import, see details: Data from Jira.

best,
Gerda