Hello eazy team,
I have a question to ask and I hope you can help me. It’s something that I see as relatively simple, but I can’t seem to achieve it.
My client asks me for a report on this:
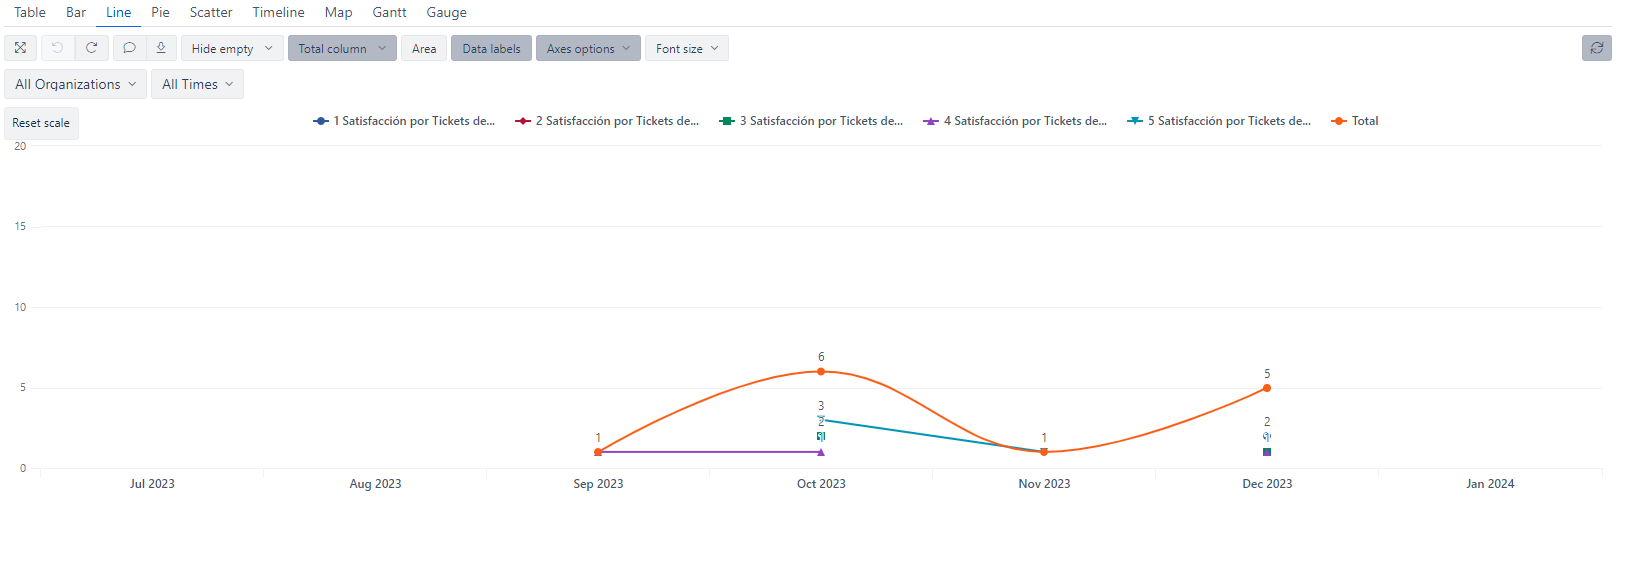
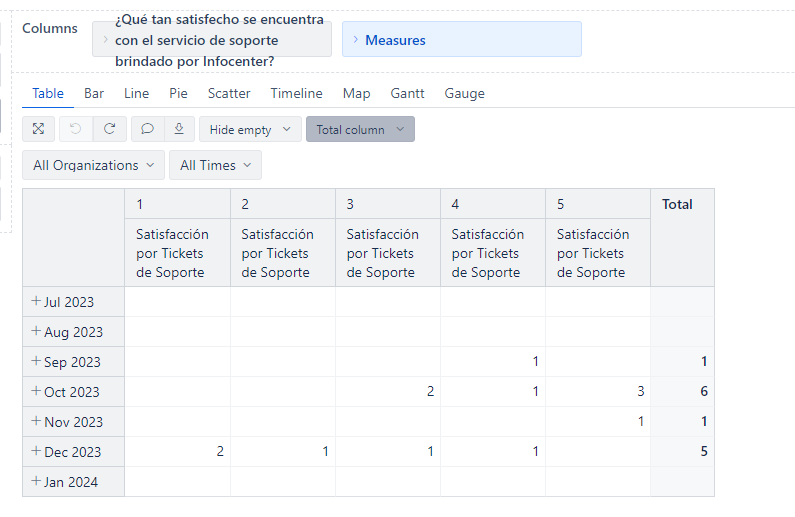
But only the orange line is visible, that is, the total. I show you the table of what I’m doing. I got the tyotal with the function: Total columns, but I can’t emulate it with any calculated metrics or I can’t hide the other columns without the total being affected.
If you have any ideas, I would appreciate it.
Greetings.