Hello eaziBI community,
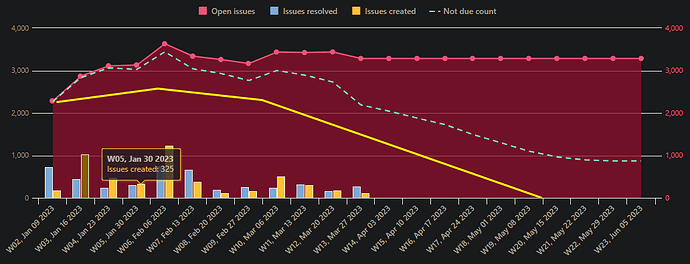
I have a chart that currently shows the following measures per week (open issues, resolved issues, created issues, not due issues). The last is a custom measure whose definition is not important right now.
In the screenshot, I manually edited a yellow line, that is originally not part of the eazyBI chart.
I would like to know if it is possible to print that line there, whose data shall be given by me in a hardcoded way, not taken from the database. That is, adding a value for each week and then printing that as a line.
Is that possible?
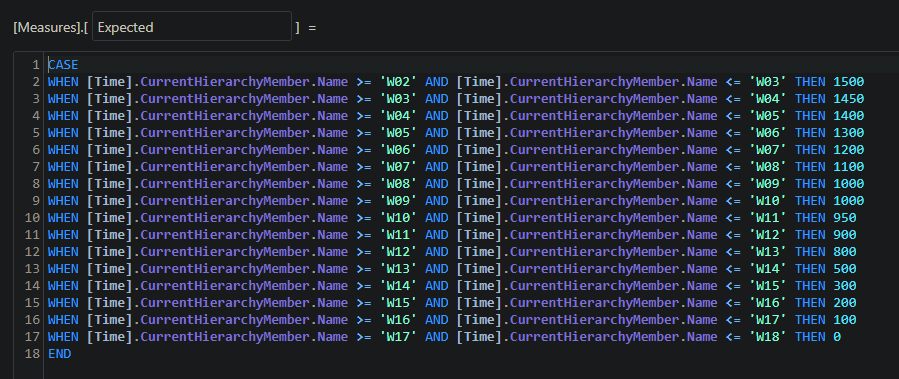
I suppose I could define a calculated measure that gives a value depending on the time. But I do not know how to do that.
Thank you in advance for your insights.
Best,
Reno

