We have a report of issues resolved monthly by type, view stacked, bar, percentage.
Stakeholders would like to have a trend line for the percentage bugs.
I have not been able to capture the combine percentage and average together
Hi @owen,
To achieve this report the sequence of actions is important.
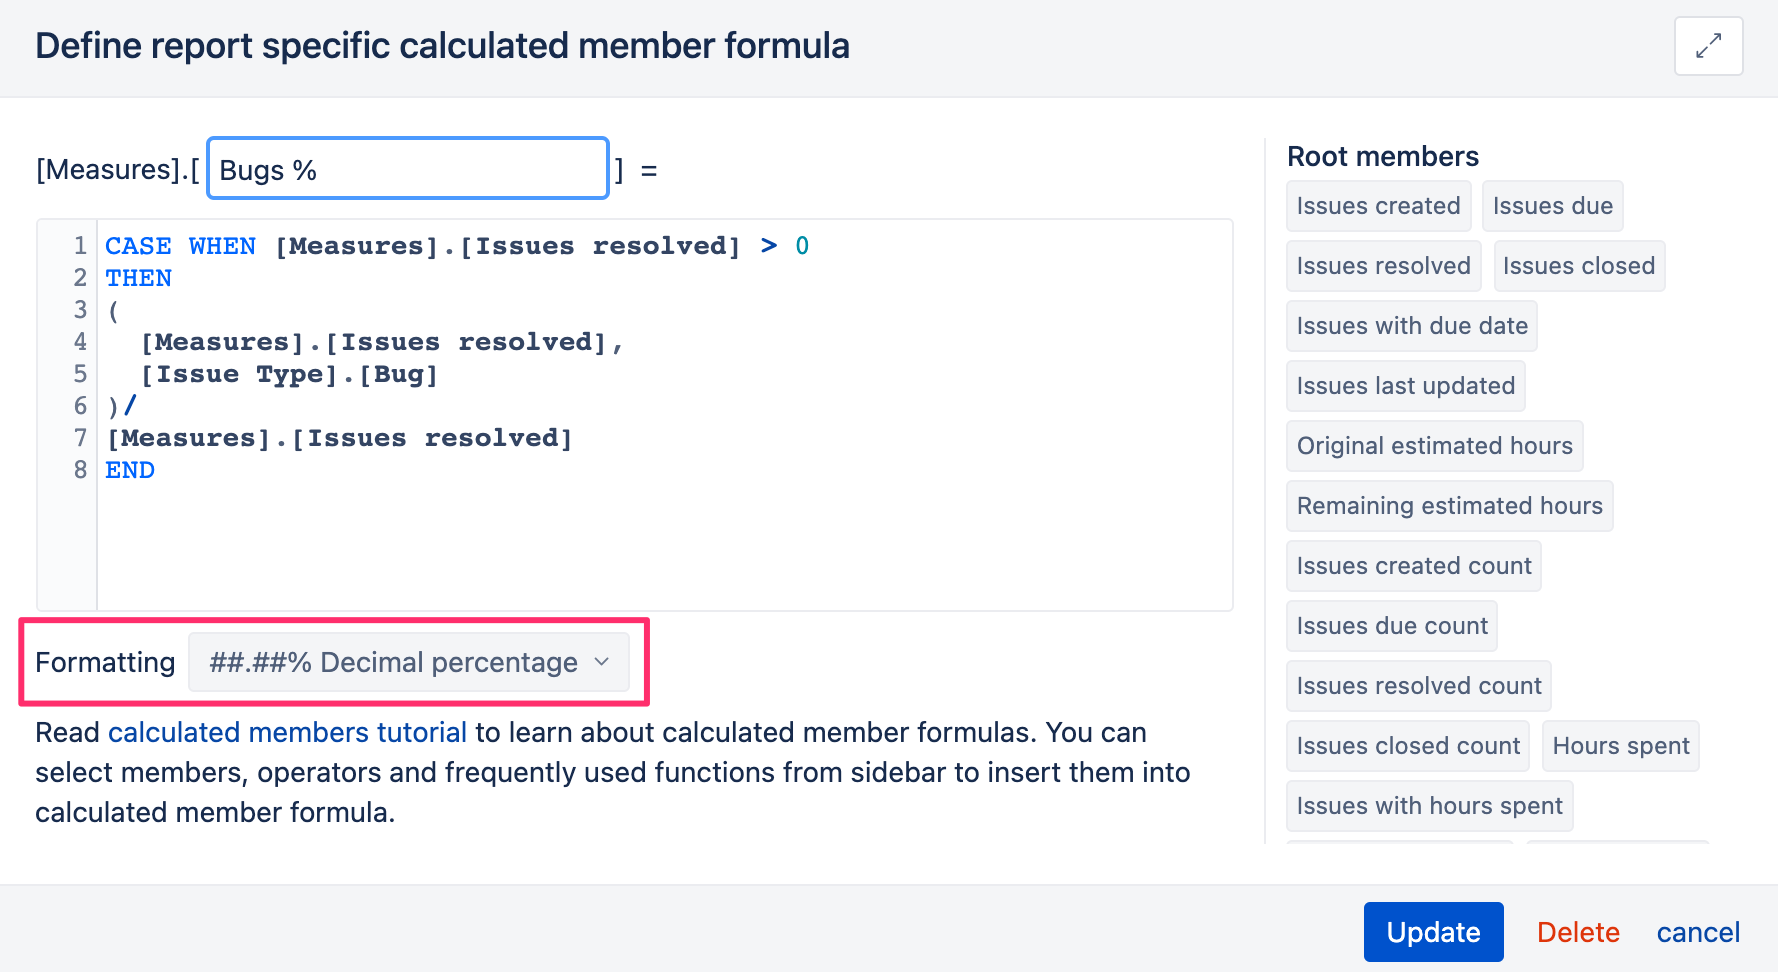
The first create Bugs % measure:
CASE WHEN [Measures].[Issues resolved] > 0
THEN
([Measures].[Issues resolved],
  [Issue Type].[Bug])/
[Measures].[Issues resolved]
END
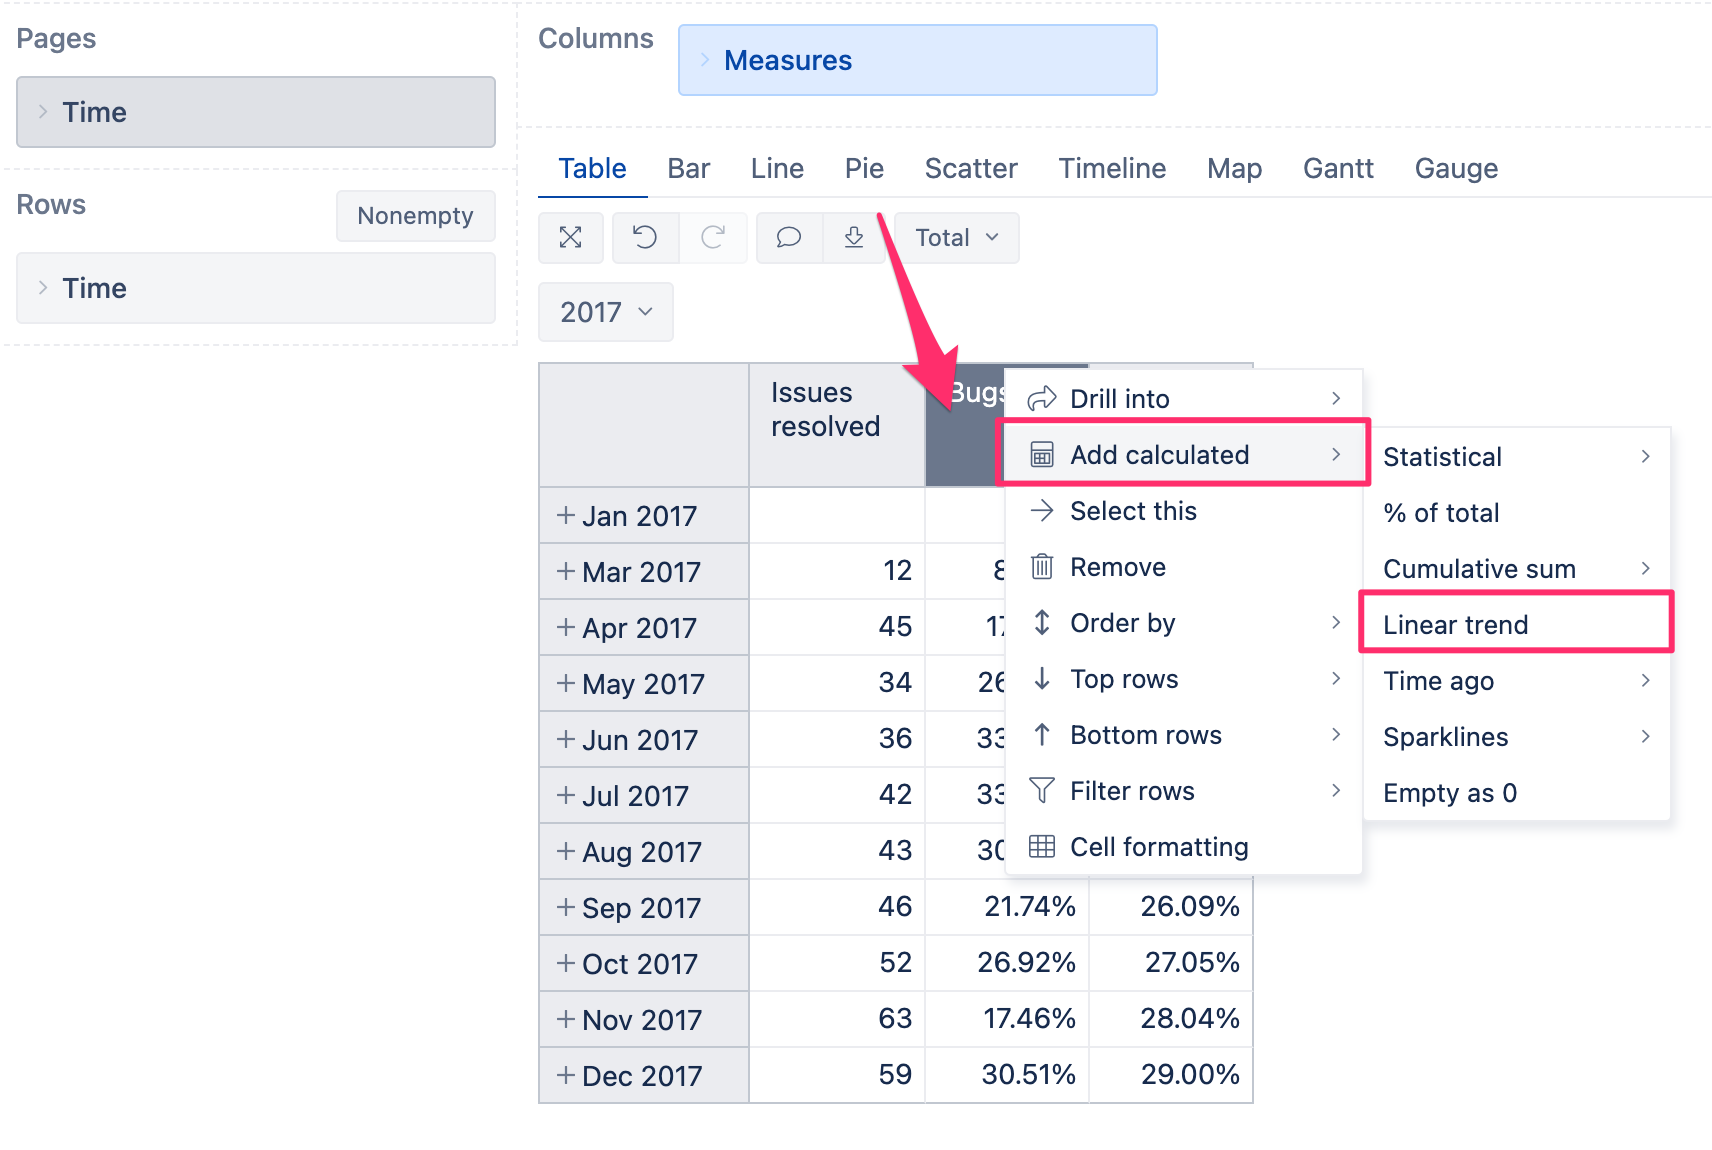
Then add a trendline to this measure with eazyBI standard calculation:
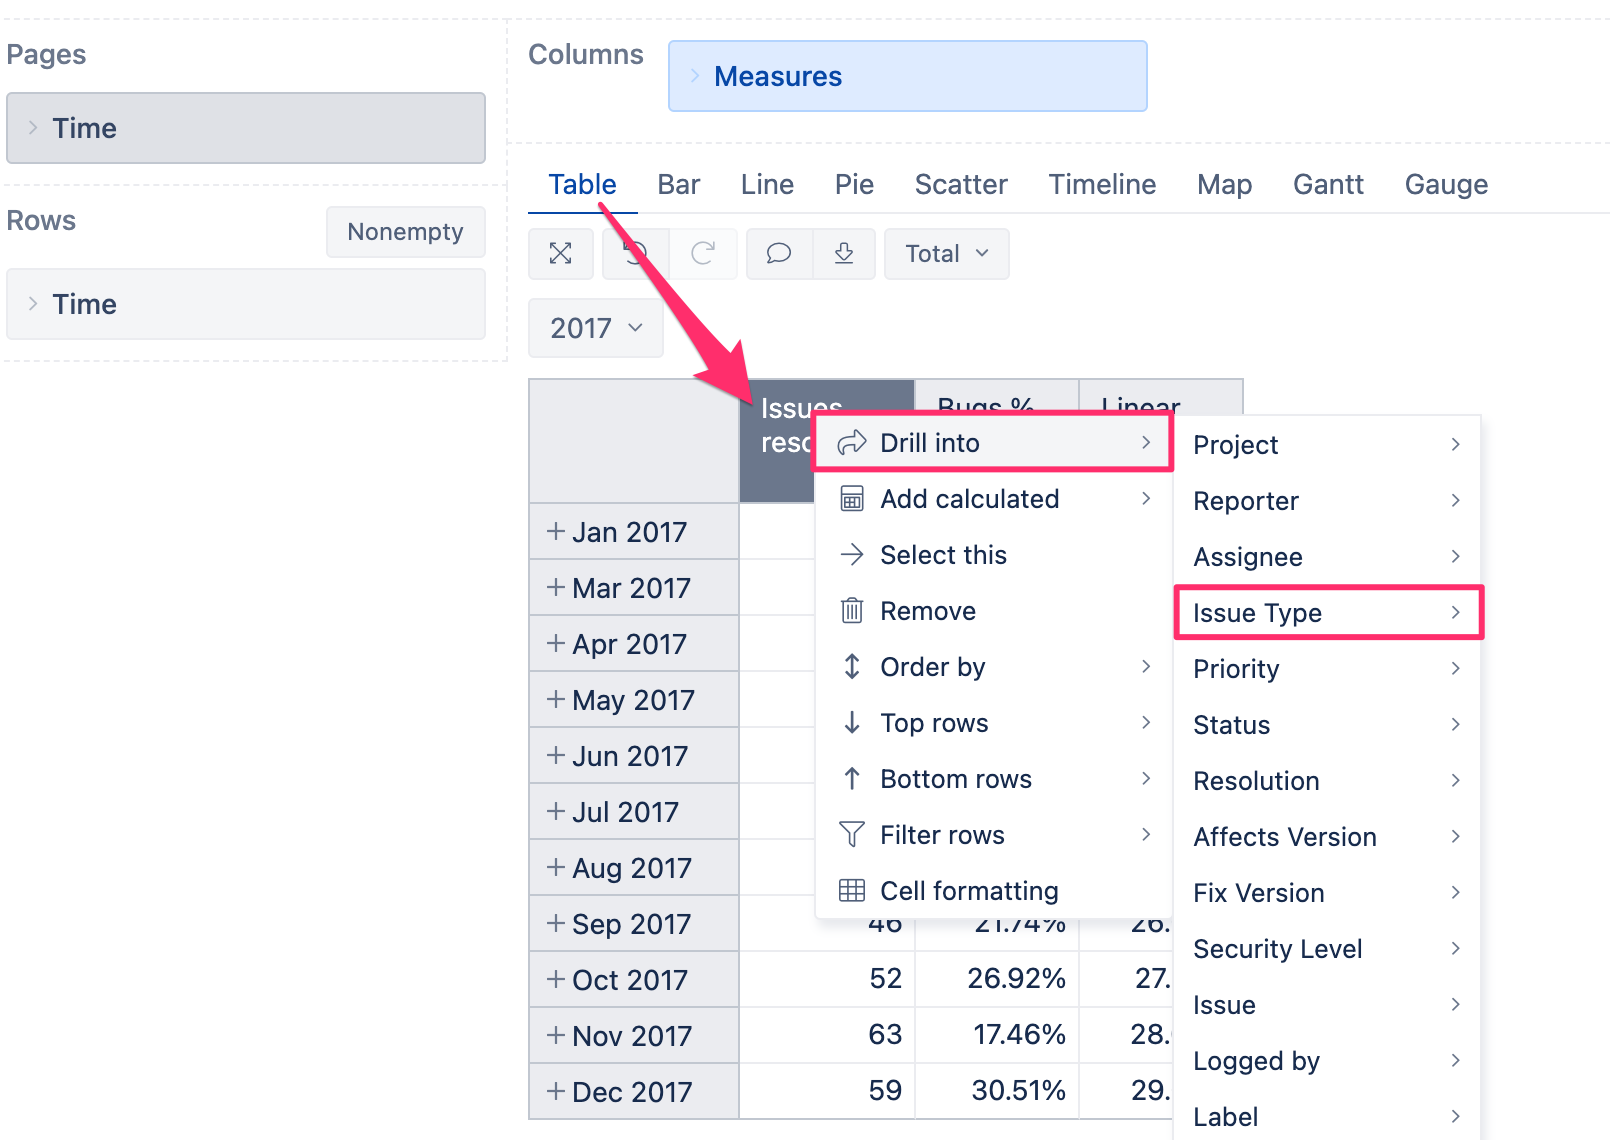
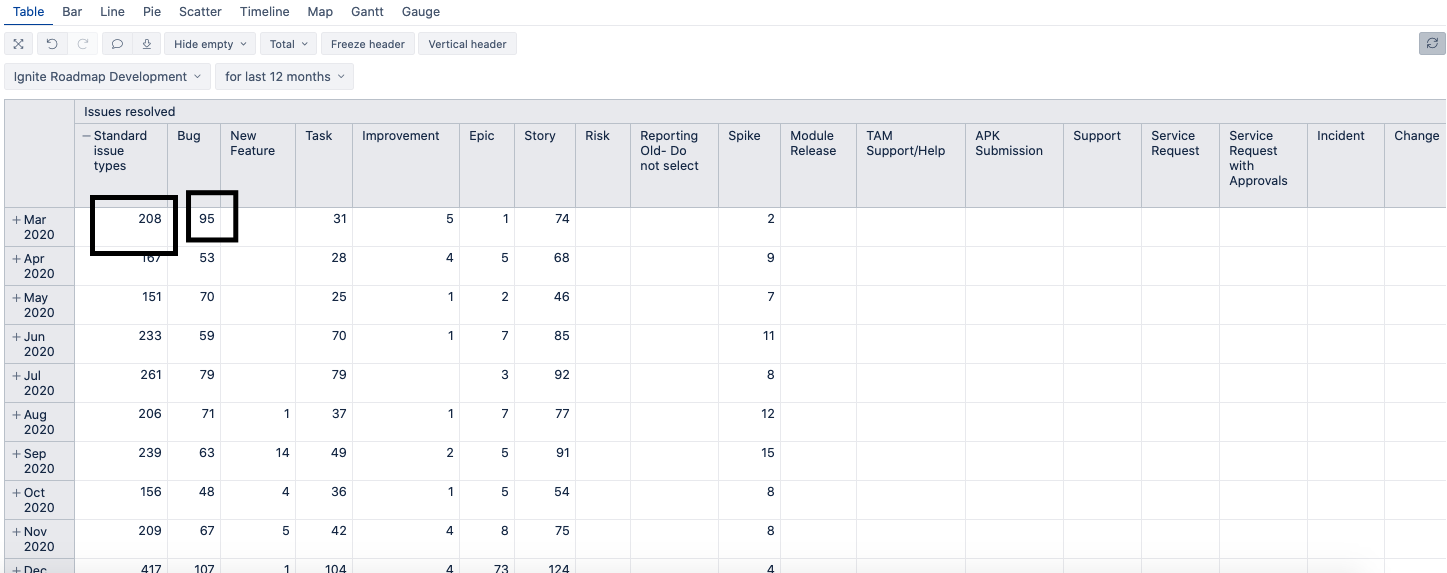
Then drill into measure Issues resolved by issue type:
Add Bugs % and Linear trend Bugs % on separate axis and the result is this:

best,
Gerda // support@eazybi.com
Thank you Gerda.
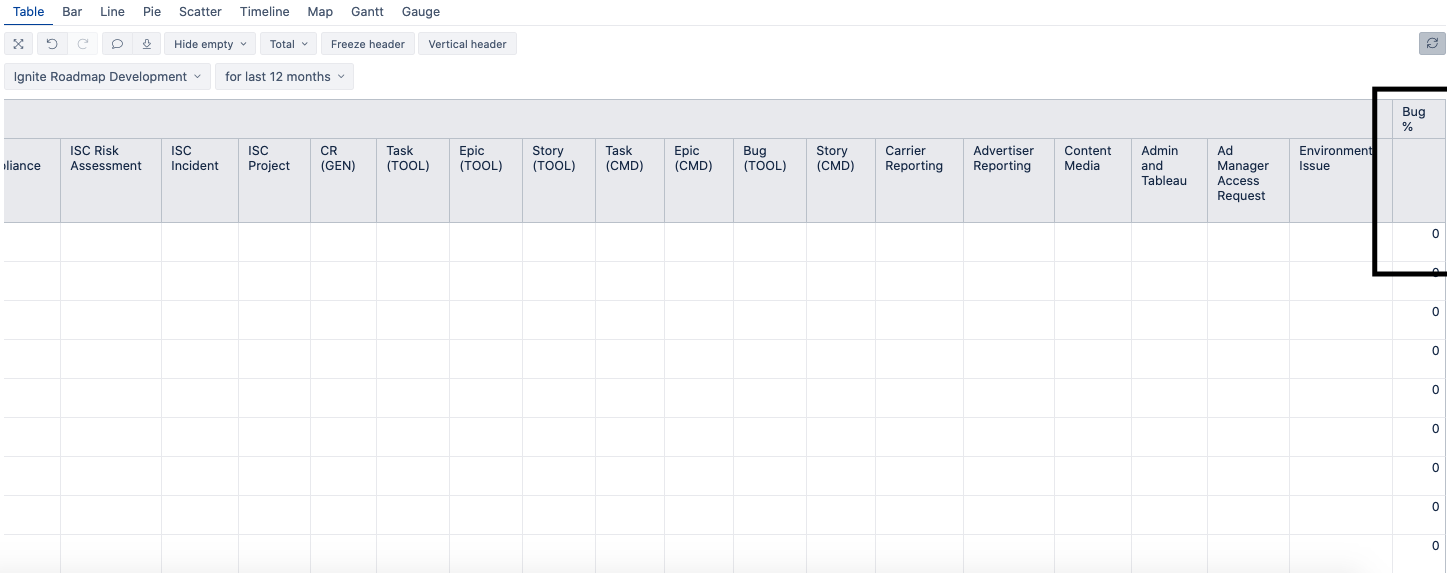
I need to filter by Project - If I add project to pages and select the appropriate Projects, the Bug % calculation results in Zero
Hi Owen,
Then it could be that there are no resolved bugs in your selected project?
best,
Gerda
@Owen , please check if you have formatting ##.## % Decimal percentage for your created measure Bugs %:
best,
Gerda
Thank you Gerda.
That worked
1 Like
Hello Gerda.
Can you help me?
How do I create a calculated field with the following rule?
if ‘hours spent’ is filled → guide line = hours remaining - hours spent
else → guide line = remaining hours - average of hours spent
Thanks.
Hi @raphalopes,
I don’t see how your question is related to the original topic, the best is to create new questions for new topics, so it is easier for other users to find answers.
The formula you asked for would be this:
  CASE WHEN
    [Measures].[Hours spent]>0
  THEN
    [Measures].[Remaining estimated hours]-[Measures].[Hours spent]
  ELSE
    [Measures].[Remaining estimated hours]-
    ([Measures].[Hours spent]/[Measures].[Issues with hours spent])
  END
best,
Gerda
1 Like