I have enabled advanced roadmap features in my project. I am trying to recreate a report of the number of issues that fall within my hierarchy (theme->initiative->epic->tasks, etc) vs ones that do not fall within that hierarchy. Once I have those 2 groups (within hierarchy, and not within hierarchy) I want to see a pie chart of one specific custom field. Essentially I am looking to see what work is done on a roadmap vs not. Can anyone give me suggestions on how to set this up?
Hi @Evan_Giordanella,
When you have imported the Advanced Roadmap hierarchy in your eazyBI account, eazyBI creates additional Advanced Roadmap dimensions.
The issues that are not in the hierarchy are under the member “(none),” and this can be used to create a report on issues which issues are in the hierarchy and which are not within it.
I am using the “Advanced Rodamp Program” dimension (you will have the “Advanced Roadmap Theme”) in Rows.
And I created in the “Advanced Rodamp Program” two calculated members:
- “Within Advanced Roadmap”:
Aggregate(
Except(
[Advanced Roadmaps Program].[Advanced Roadmaps Program].Members,
{[Advanced Roadmaps Program].[(none)]}
)
)
- “Outside Advanced Roadmap”
[Advanced Roadmaps Program].[(none)]
And them I am using those members to see the count of issues in the hierarchy and outside it:
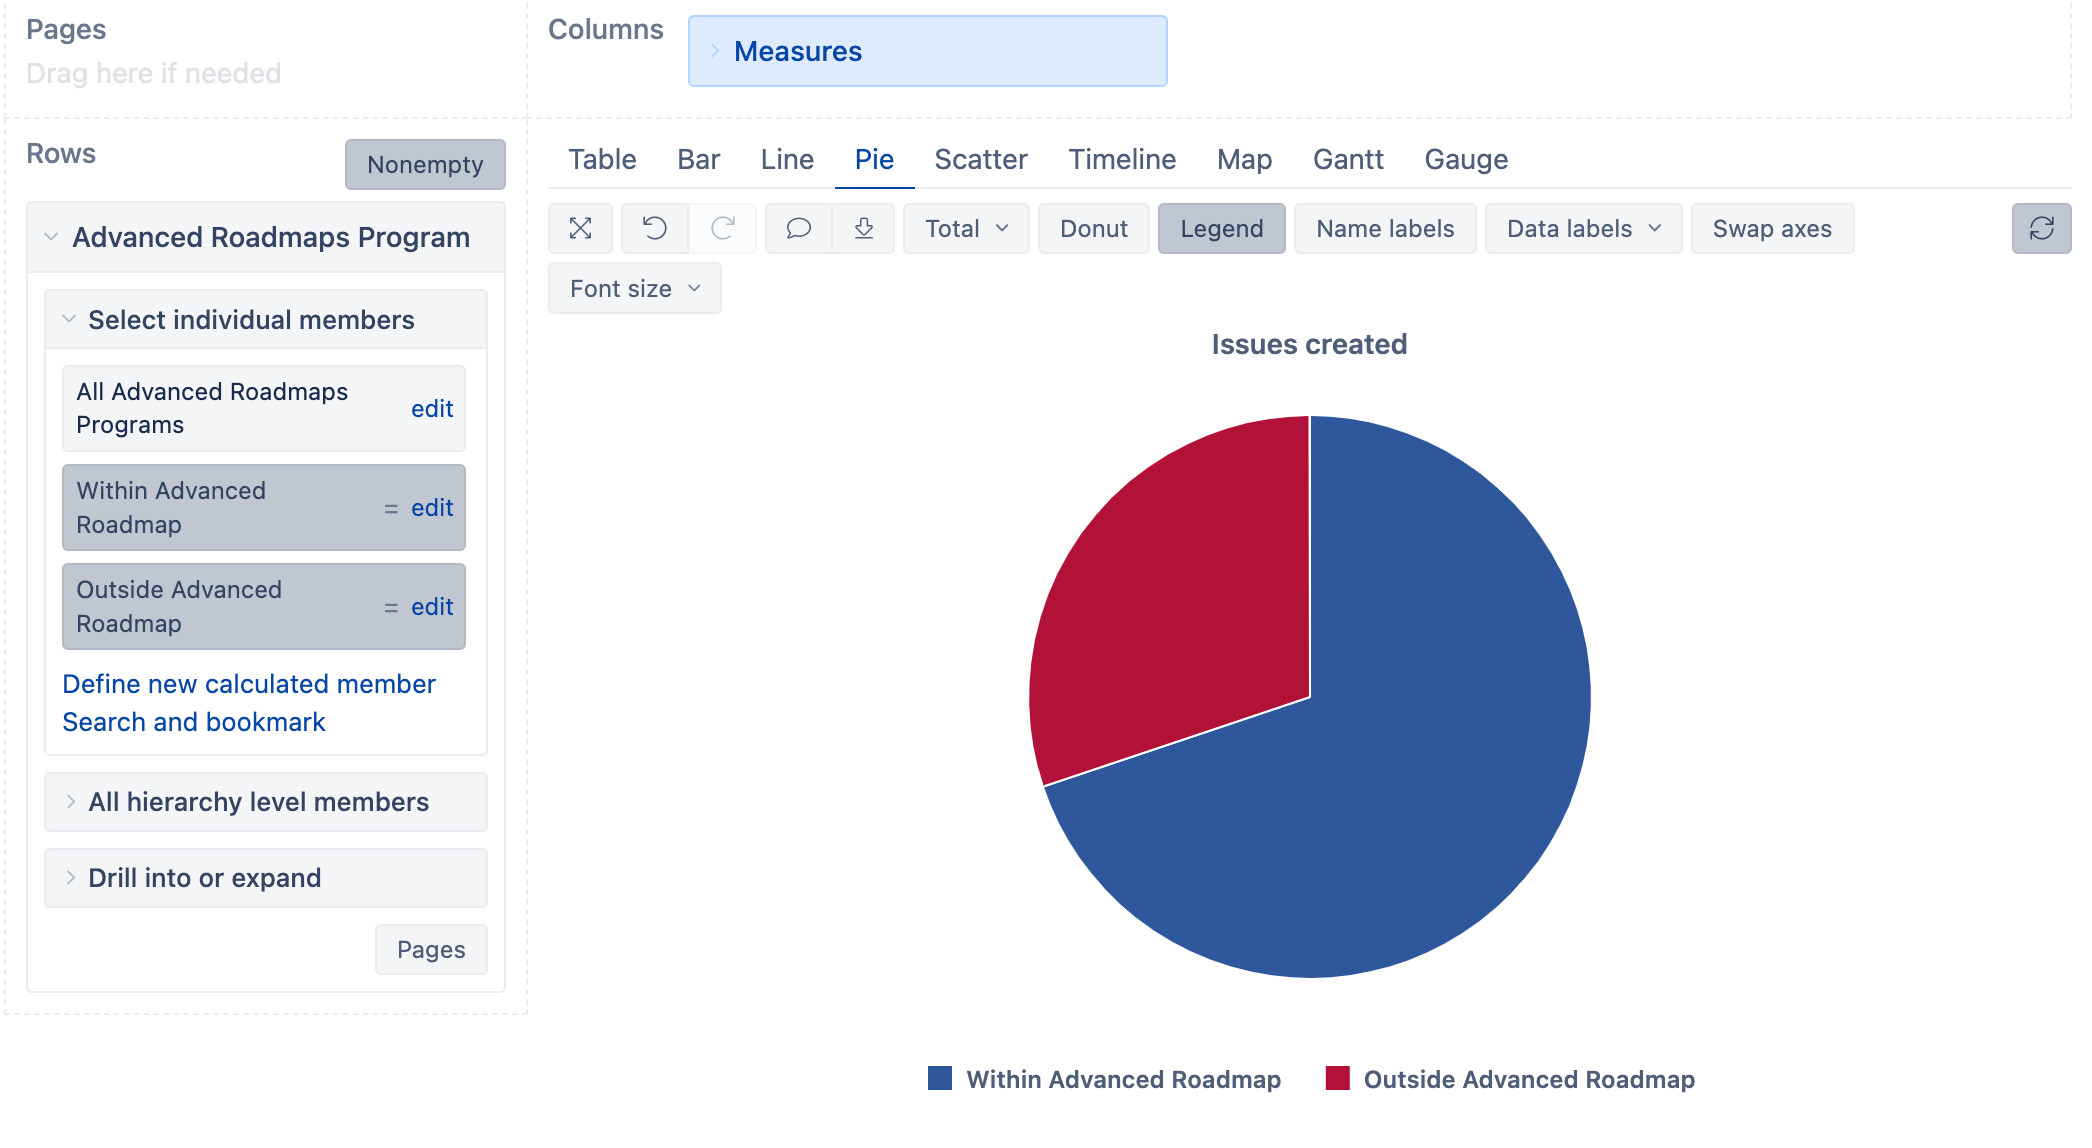
best,
Gerda // support@eazyBI.com