I am trying to show a column chart on the count of ticket aging.
Namely, on the Rows, I have status from opened, triaged, closed. The column I have 00-06, 07-13, 14-21, 21-… All the closed ticket count are showing up in (None).
I tried to create a calculated measure mixing [Age Interval] members and [Resolved Interval] members, but EazyBI is complaining about mix hierarchy.
This is so because these are two different types of interval dimensions:
The Age interval shows the age of unresolved issues - how much time has passed since an unresolved issue was created until now (a ‘moving date’).
The Resolution interval shows the interval between two ‘unmoving’ dates - from creation until the resolution date. This is just for the resolved issues that have this constant second date.
You could create two reports, using Issues due with the Age interval dimension and Issues resolved with the Resolution interval dimension, and place them in a dashboard next to each other.
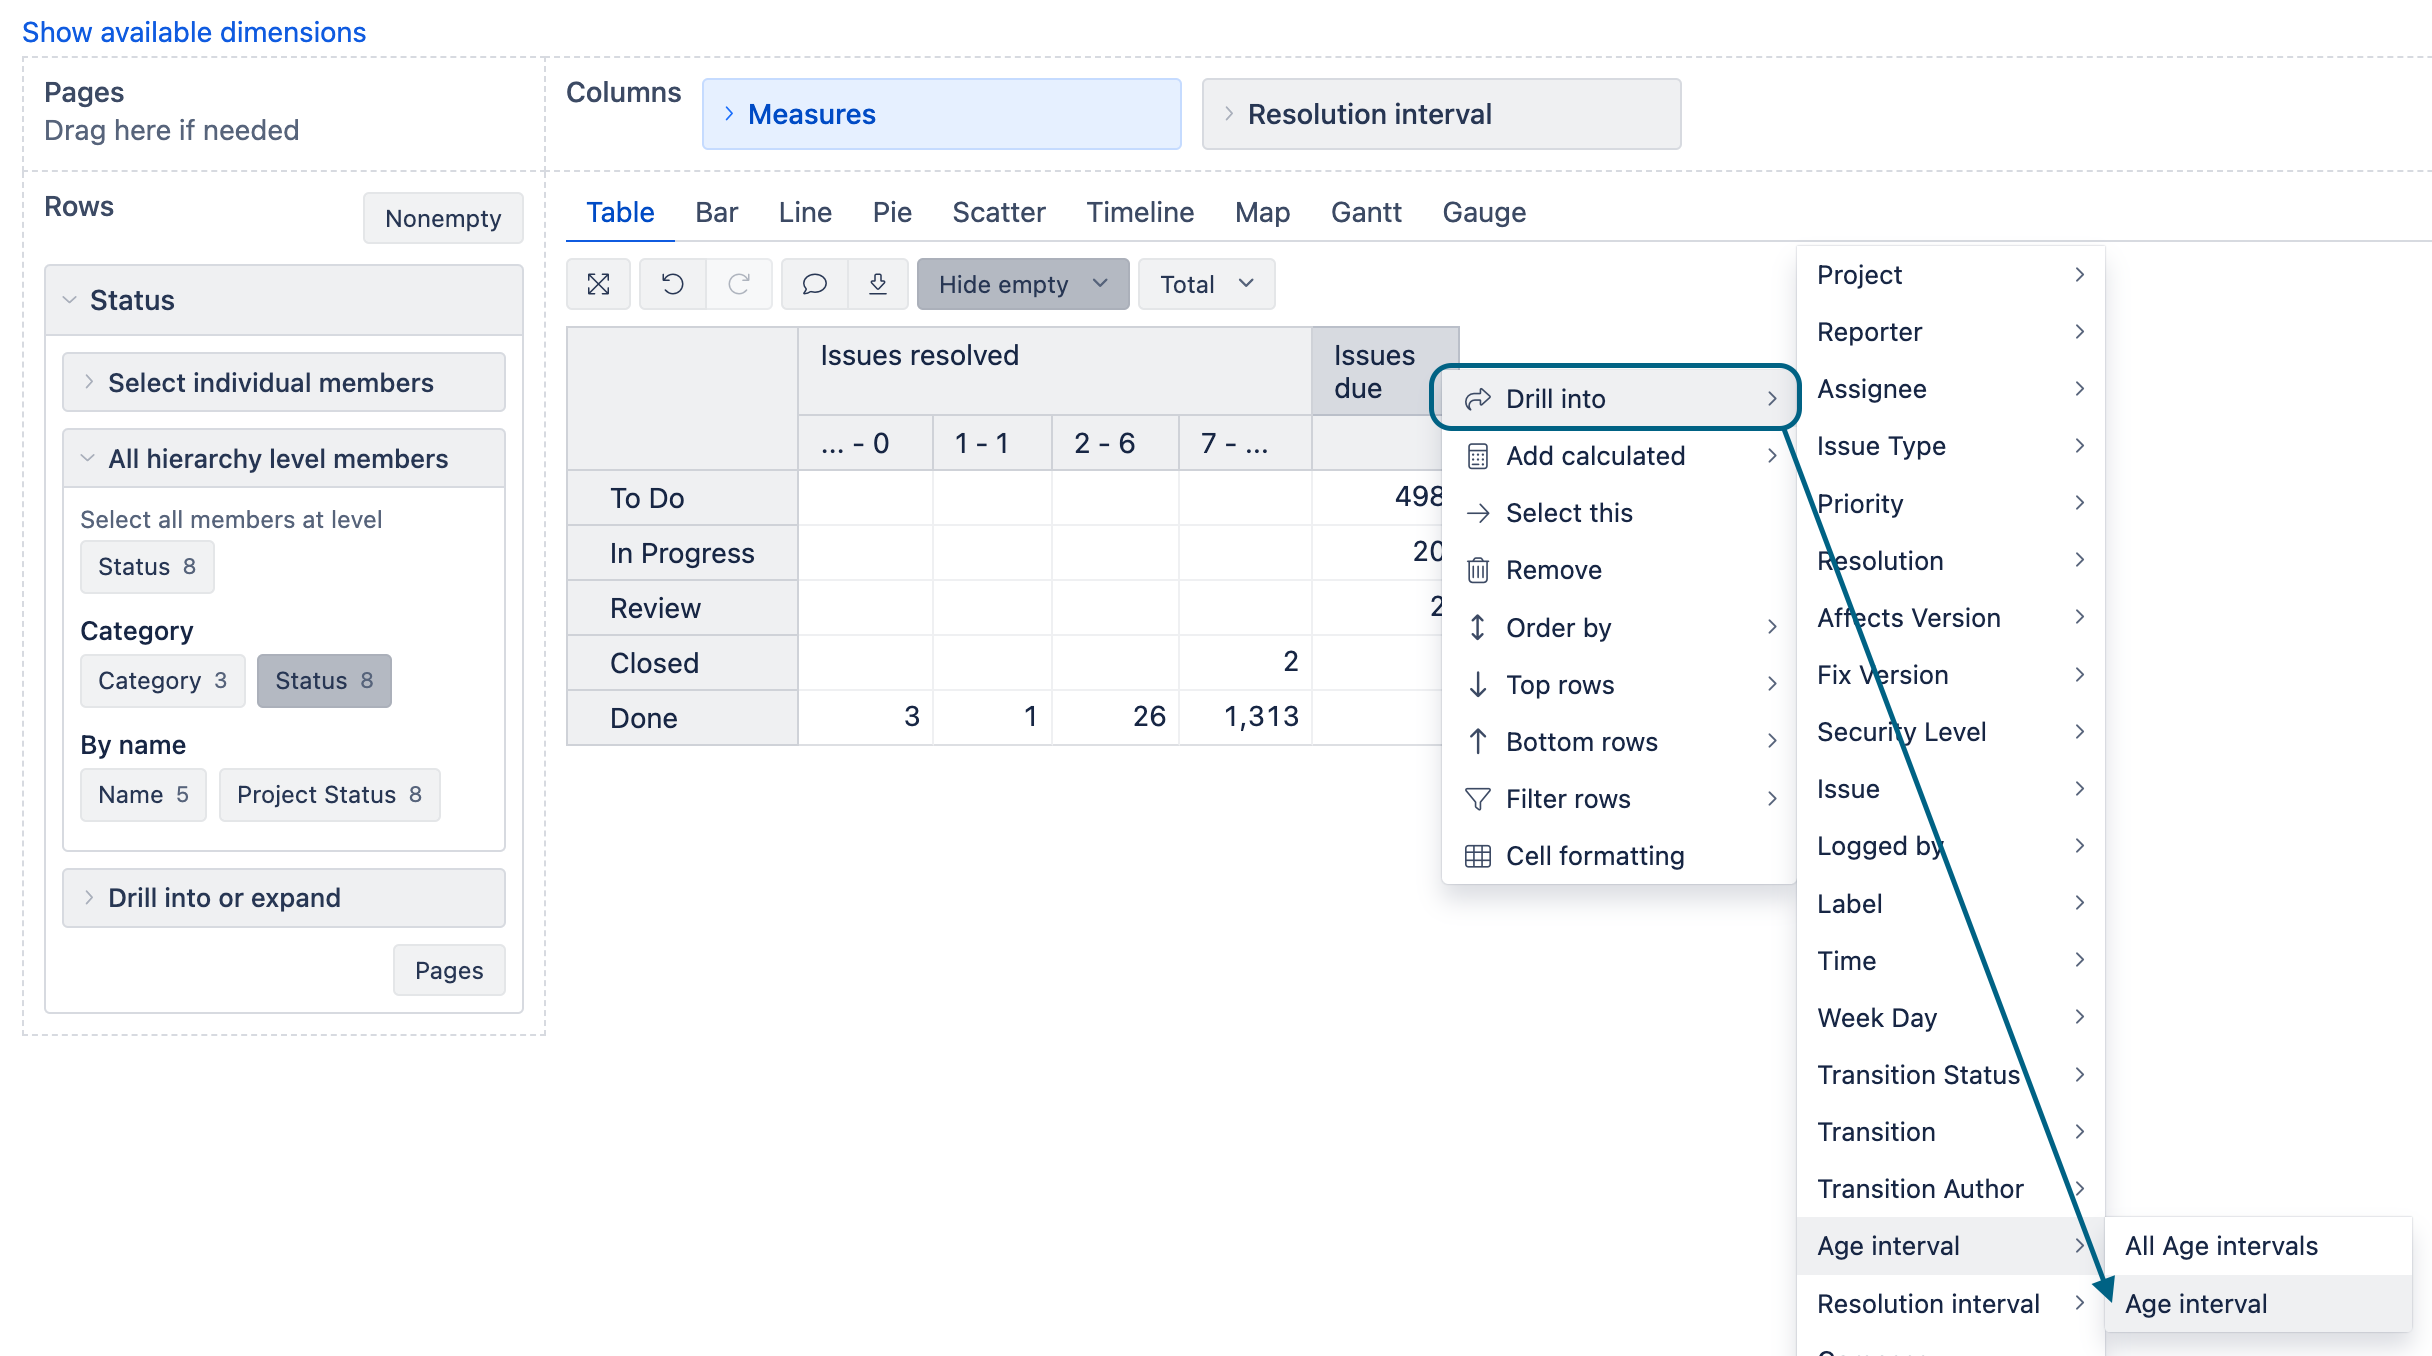
Another option would be to use a Drill-into option when you have both of these measures in one report: