For a specific report I want to measure the amount of days an issue spends in average in a specific stage, measured by release.
Related to this, I want to create a higher level report and report the average amount of days spent across a set of states
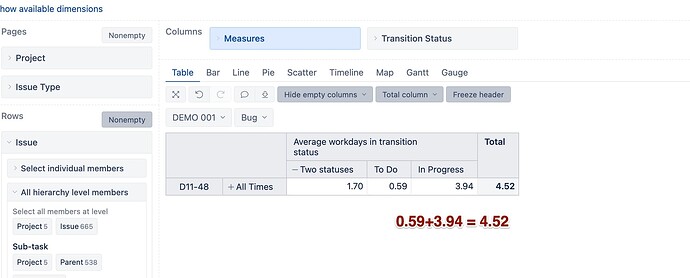
For the validation I’ve been using the TOTALS feature and I’ve been looking at the individual members of the Aggregate function → though all individual members are the same for both, I don’t get the same outcome
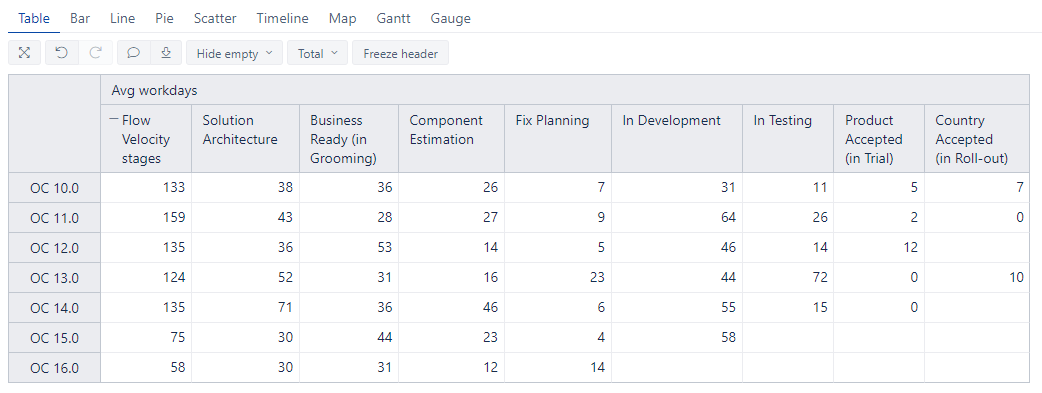
38 36 26 7 31 11 5 7 = 161 (TOTAL)
38 36 26 7 31 11 5 7 = 133 (AGGREGATE)
(Exact sum = TOTAL, difference between both = 28)
→ How can this difference be explained?
More details on how I’ve created the report:
COLUMNS:
a) Measures: Counting average days: OK, created a custom measure as documented elsewhere in this community and turns out to work fine
b) Transition status
Observed behaviour:
Situation 1: individual states
- I select each of the transition states I’m interested in through bookmarking (Transition status)
- At the end I want to know the totals - so I’m using the TOTAL function, standard in EazyBI
- This gives me the following table:
Calling out 1 example:
38 36 26 7 31 11 5 7 = 161 (TOTAL)
Situation 2: grouping the same states through calculated measure in Transition status through the Aggregate function
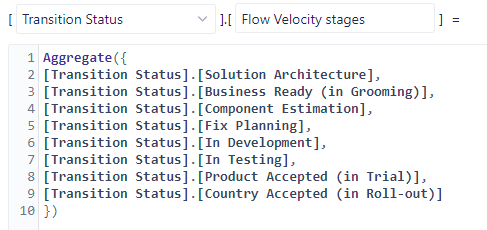
Calculated measure:
Aggregate({
[Transition Status].[Solution Architecture],
[Transition Status].[Business Ready (in Grooming)],
[Transition Status].[Component Estimation],
[Transition Status].[Fix Planning],
[Transition Status].[In Development],
[Transition Status].[In Testing],
[Transition Status].[Product Accepted (in Trial)],
[Transition Status].[Country Accepted (in Roll-out)]
})
Calling out 1 example:
38 36 26 7 31 11 5 7 = 133 (AGGREGATE)
Question: When looking at the Total of the individual states and when looking at the value of the Aggregated dimension, I got different values
→ I expected that Aggregate would simply give me the sum of the individual members?


