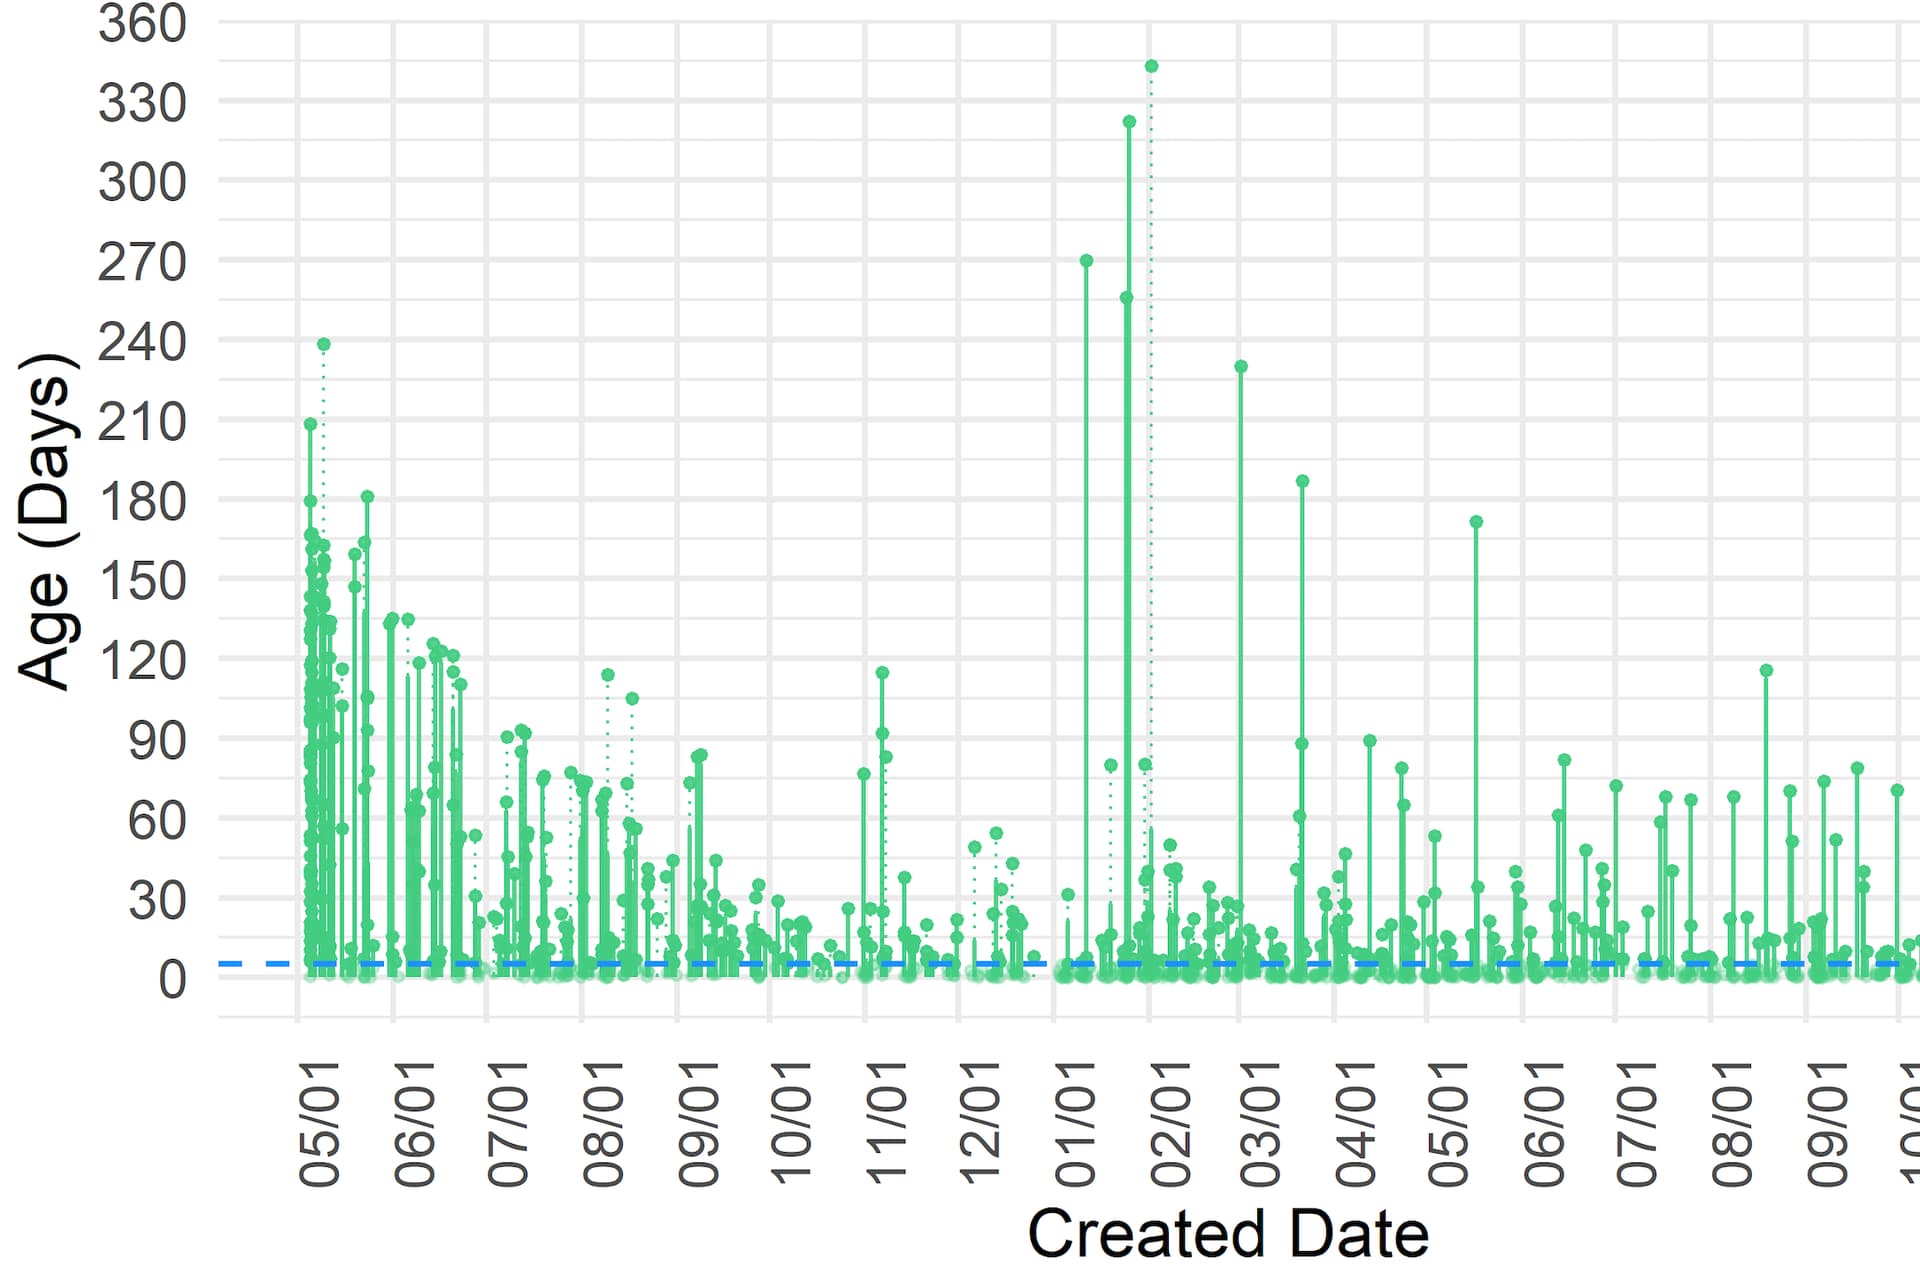
How do I generate individual aging chart of issues. where X-axis is created date of ticket and Y-axis is number of days it is open. Ideally I would like to filter on priority tickets on the graph.
Hello @sgolla,
The most straightforward way to build such reports would be to import the Interval dimensions: Interval dimensions
Go to Source data - > Jira import options → Additional options and make sure you have selected Interval dimensions for import.

Once Interval dimensions have been imported you can build the following reports:
- Add Age Interval dimension in Rows
- Add Issue dimension in Rows
- Select “Open issues” measure under Measures
- switch to Bar chart, choose to display results “Vertical” and add Data labels. You can adjust the colors and other report elements, see more: Customize chart
This report shows the Age interval on the X axis in segments of 10 days (you can adjust it if needed). The numbers on top of each bar chart represents the number of isses that are open in each Age interval.

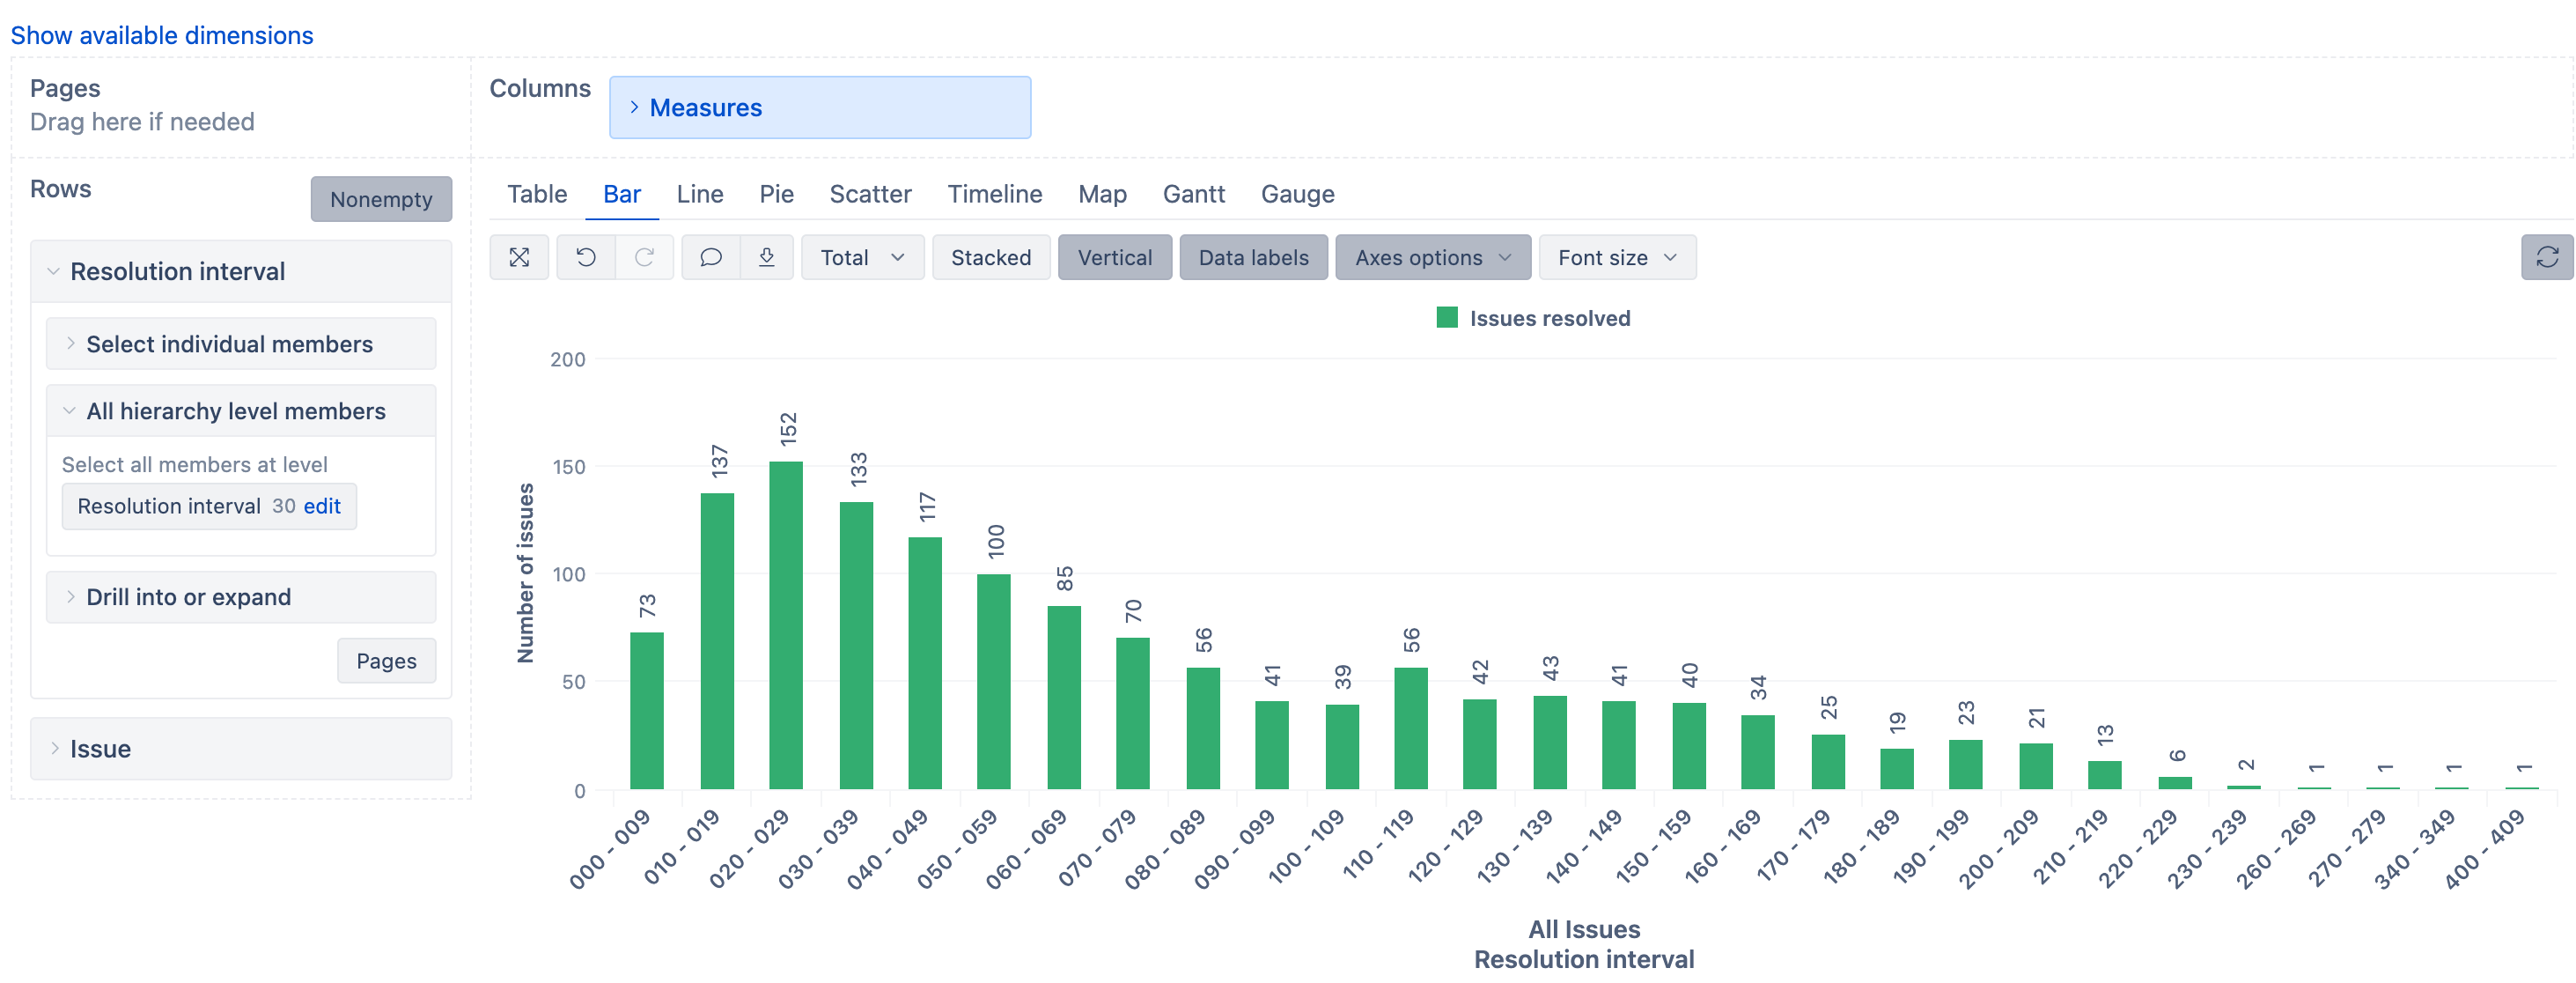
Similarly, you can create a report with Resolution intervals to check the age of issues that have been resolved.
- Add Resolution Interval dimension in Rows
- Add Issue dimension in Rows
- Select “Issues resolved” measure under Measures
- switch to Bar chart, choose to display results “Vertical” and add Data labels.
I hope this helps.
Best,
Marita // support@eazybi.com