Hello! is it possible to show the standard deviation on a sprint velocity chart based on story points? Thank you
Hi @Emiliano_Romero,
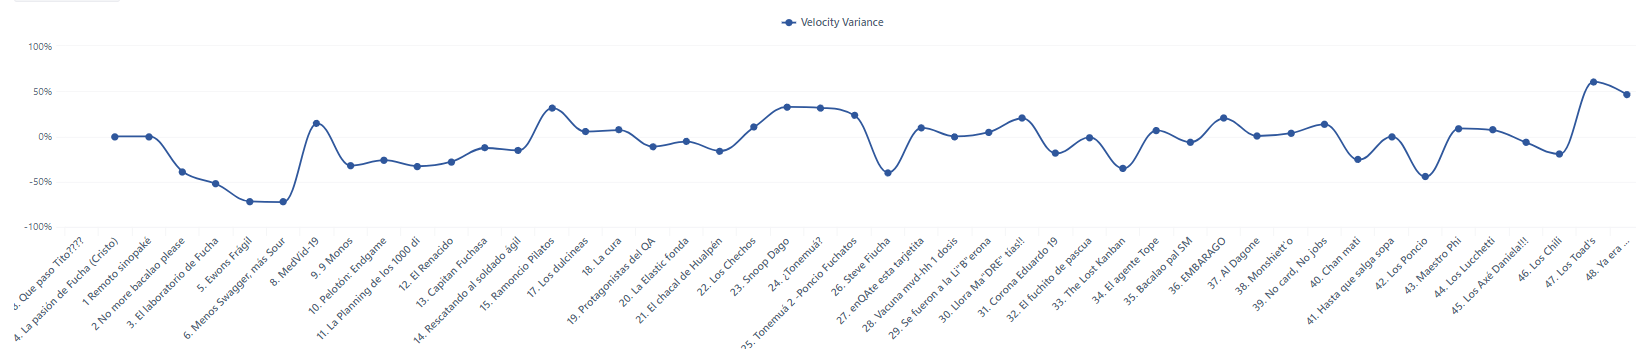
Yes this is possible. Check out this post that has a tutorial: Agile Reporting: Velocity Variance and Story Size
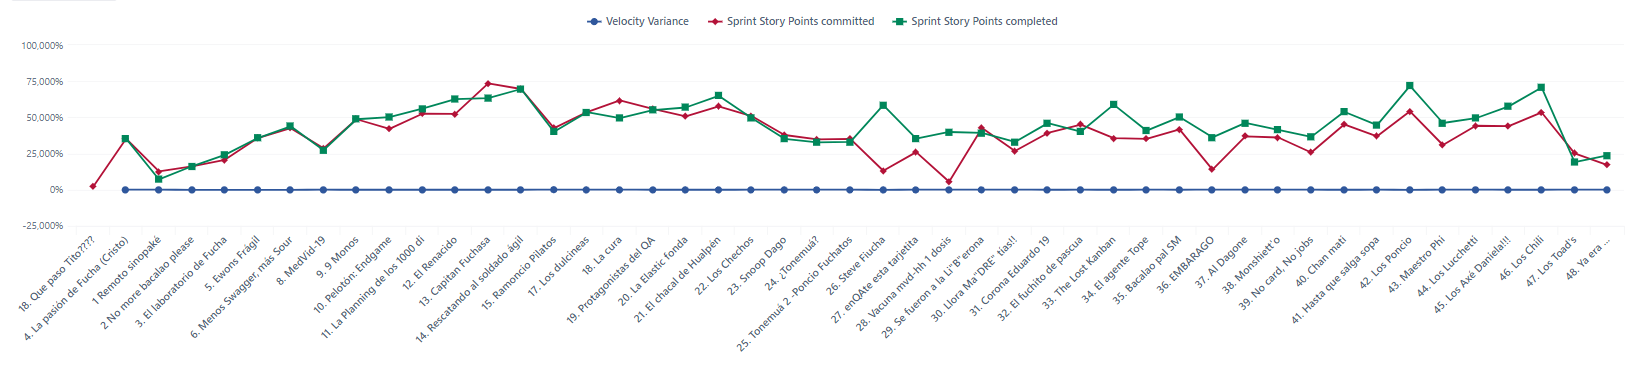
You can then just add the story points commited and story points completed as separate columns and display them as bar charts. Link: How to Create your first Sprint Velocity Chart - #2 by eli_solutions
Regards,
Fabian
Hi Emiliano,
That’s because you have them in the same axis. You sould have a separate axis for variance since it’s a percentage.
Regards,
Fabian