I’m brand new to EazyBI – please excuse me if this is obvious and I’m just missing the documentation in my searches.
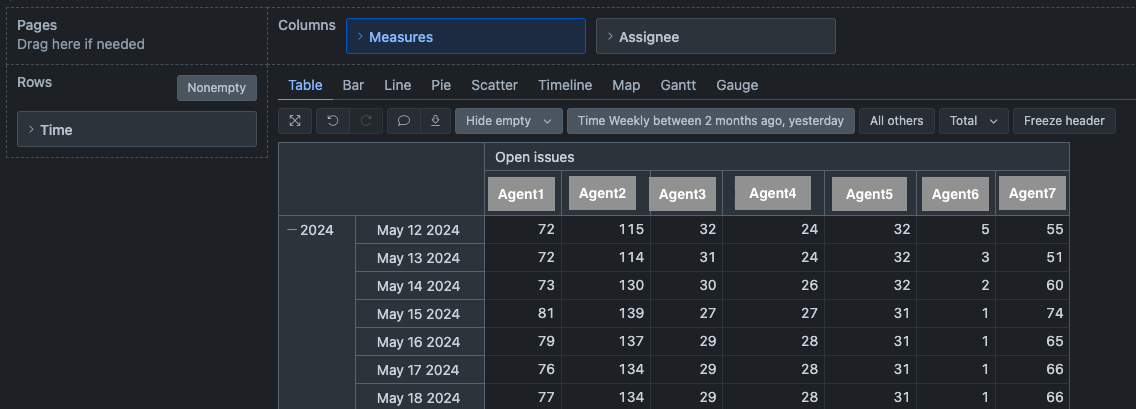
My goal is to track issue backlog over time by assignee. I currently have a report that has Time as rows, by day, and columns for each of a group of Support agents. The fields are counts of Open issues (the predefined “Open Issues” measure). It looks like this:
“Agent4,” however, had zero tickets on May 12th, they didn’t start until a later date. The number there appears to be a count of tickets that: a) were open on May 12th and b) were resolved by Agent4 sometime in the future. This makes me think the measure is not looking at who was assigned on that day, but who is assigned today. I can pull the right value from Jira by counting the results of this filter (which correctly says 0 on this date for Agent4):
project = PROJ
AND status WAS NOT IN (Canceled, Closed, Completed, Done, Resolved, Published) ON "2024/05/12"
AND assignee WAS [user] ON "2024/05/12"
How do I get the number of issues assigned to each assignee on that date?
Bonus question: How would I add an average column that simply takes the average of the agent’s open tickets on that date?
Thanks for posting your questions and Welcome to eazyBI Community!
I apologize for missing this question!
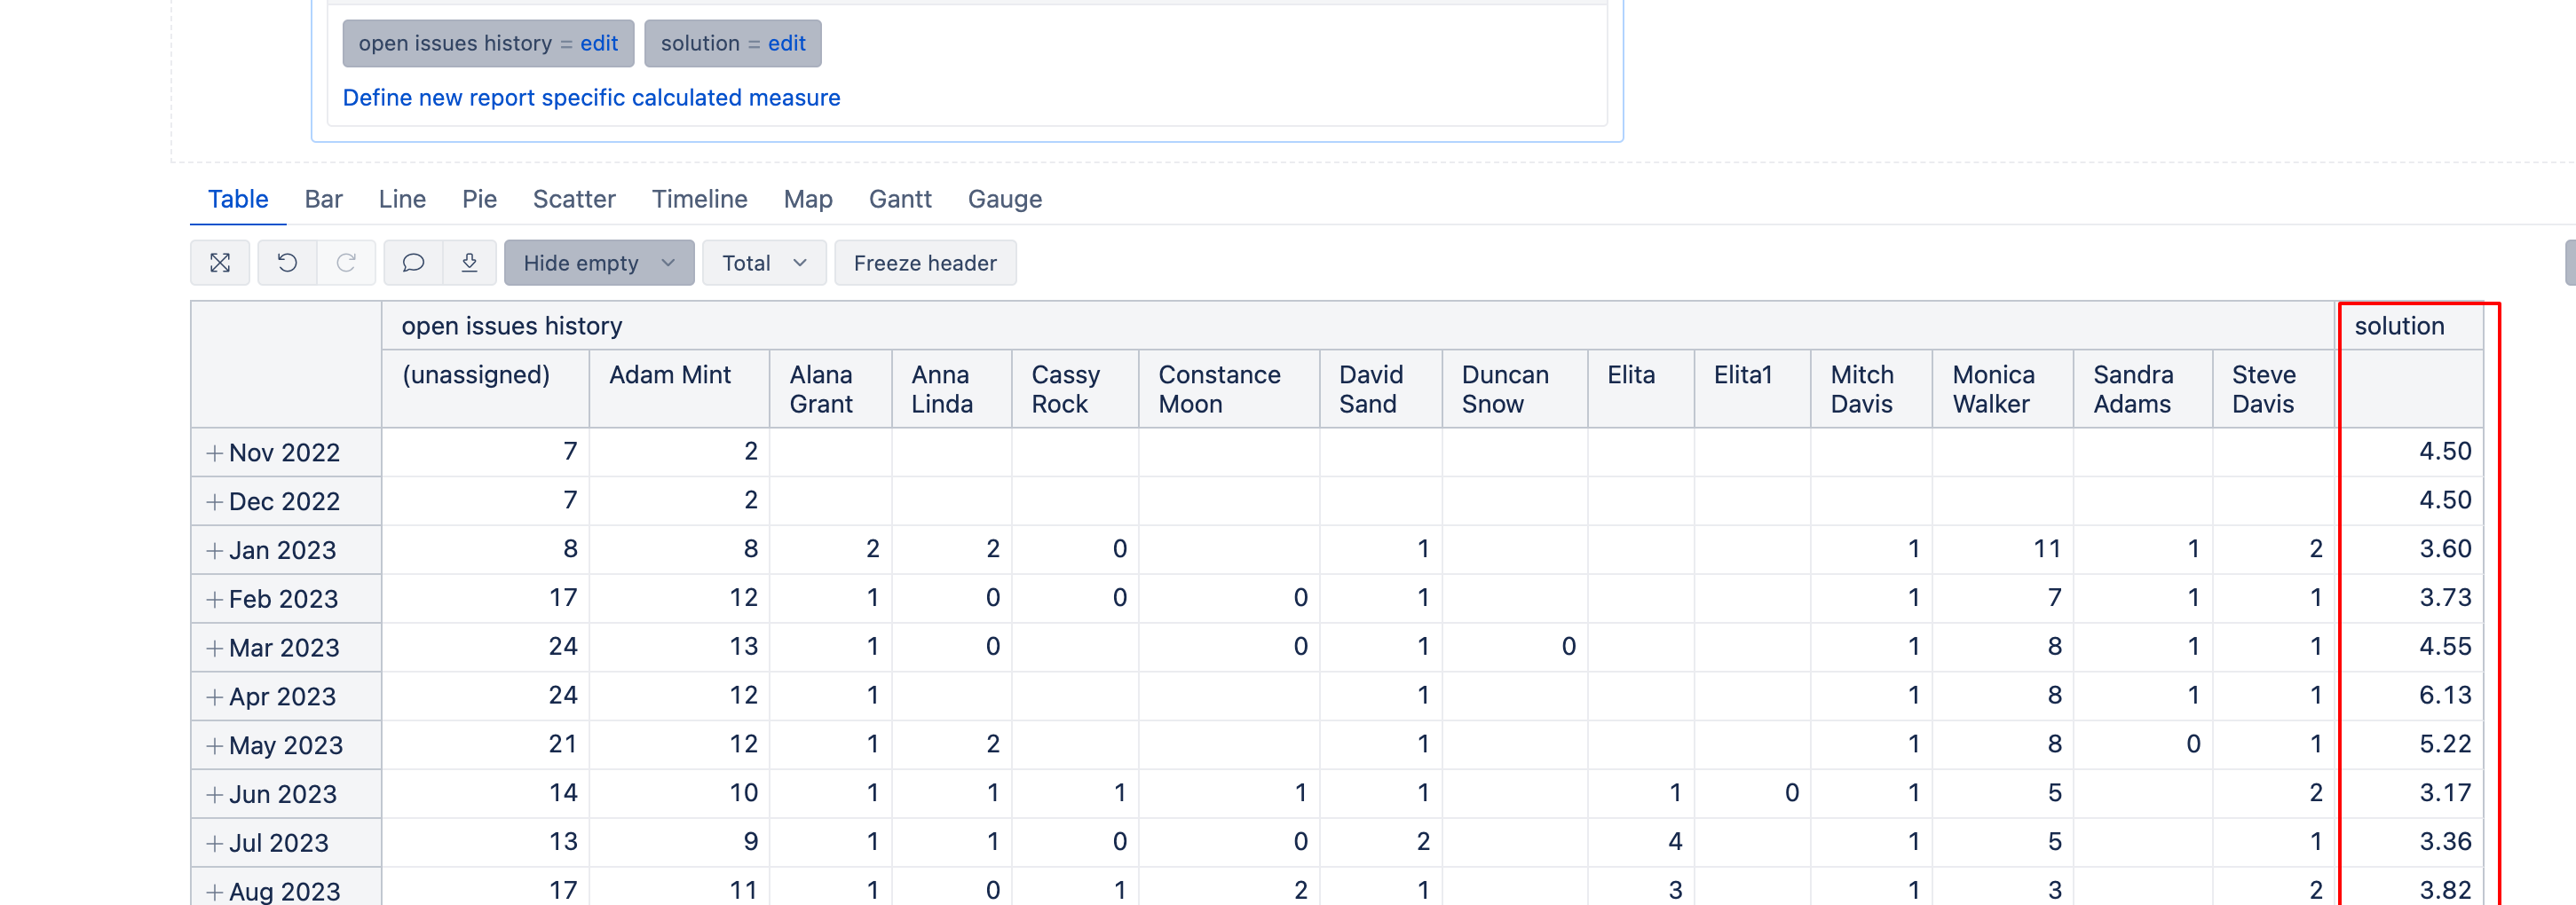
Please try the Issues History measure along with Resolution status unresolved in a Tuple function (Tuple) as I’ve pasted below with the Assignee dimension Columns as you already have in your report. This measure will return All unresolved issues for the selected assignees grouped by the the end of each selected month:
You may first want to remove the Asssignee dimension from the Columns. Next to your new formula for the open issue history, add the one I just pasted above to calculate the Row Average. Then drill into the Assignee dimension form the Open issue history measure - learn more how to interact with measure name here - Interact with report. It shold give you a similar report as i’ve pasted below: