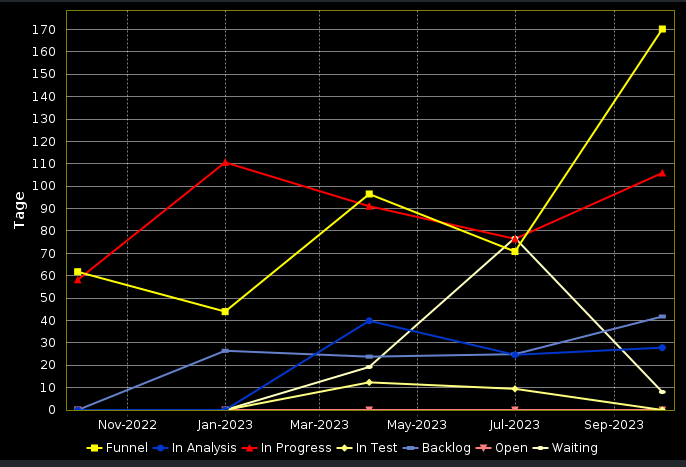
Hi,
I would like to create a report that shows me all closed issues per quarter and shows how long the issues were in the status funnel. The display should be exactly like the Jira dashboard (see image). If I do this with “Average Days in Transition Status”, I only see issues that are in the status funnel in the respective quarter and as of today. But that’s not the point of the matter, as I want to see all issues that were closed in, for example, quarters 1, 2 and 3 of 2023 and how long the issues were in a status before they were closed.
Can anyone help?

Hi @Kodiak21,
By default, the eazyBI measure “Average days in transition status” is calculated when an issue is transitioned from a particular status (when the “Transitions from status” measure is recorded) and will be shown on Time dimension on the date when the transition from this status happened.
If you wish to link the issue average days in transition status by the issue closed date then you can use this formula:
Sum(
  Filter(
    DescendantsSet([Issue].CurrentMember,[Issue].[Issue]),
    -- link measure to time by issue closed date
    DateInPeriod(
      [Measures].[Issue closed date],
      [Time].CurrentHierarchyMember
    )
  ),
  -- ignore how the measure is linked to time dimension
  ([Measures].[Average days in transition status],
  [Time].CurrentHierarchy.DefaultMember)
)
best,
Gerda // support@eazybi.com
