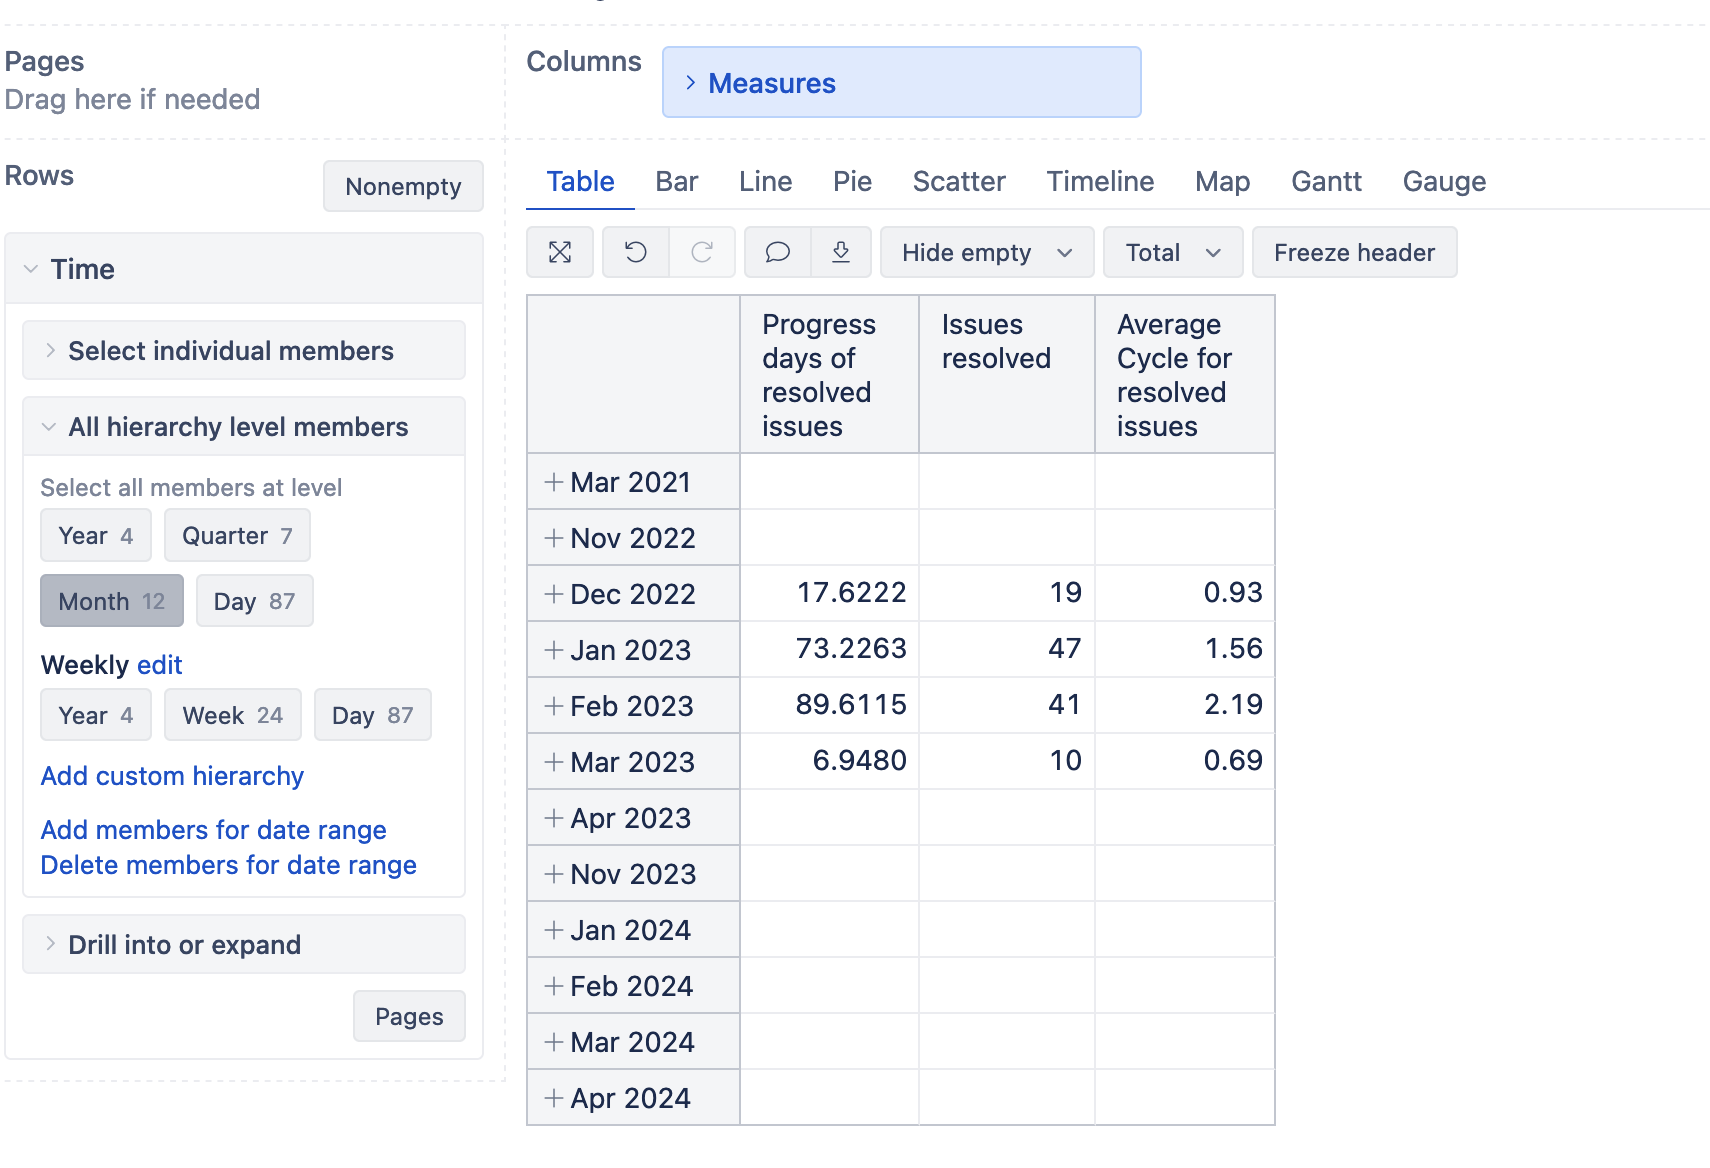
I’m trying to build a Cycle Time graph that is showing monthly value of average In Progress category for all issues (X axix - month, Y axis - average time in transition status).
As I understand now, Average days in transition status are calculated this way:
Issue 1
Transitioned from In Progress to Ready to Deploy - 10 days
Transitioned From Ready to Deploy to Done - 20 days
Average time in transition status category In Progress for issue 1 = 15 days
Issue 2
Average time in transition status category in Progress for issue 2 = 5 days
What I need is total In Progress category per issue, averaged for a month:
Issue 1 - sum of in progress category = 30 days
Issue 2 - sum of in progress category = 5 days
Average days in transition category In Progress by resolution month = 35 total days / 2 = 17,5
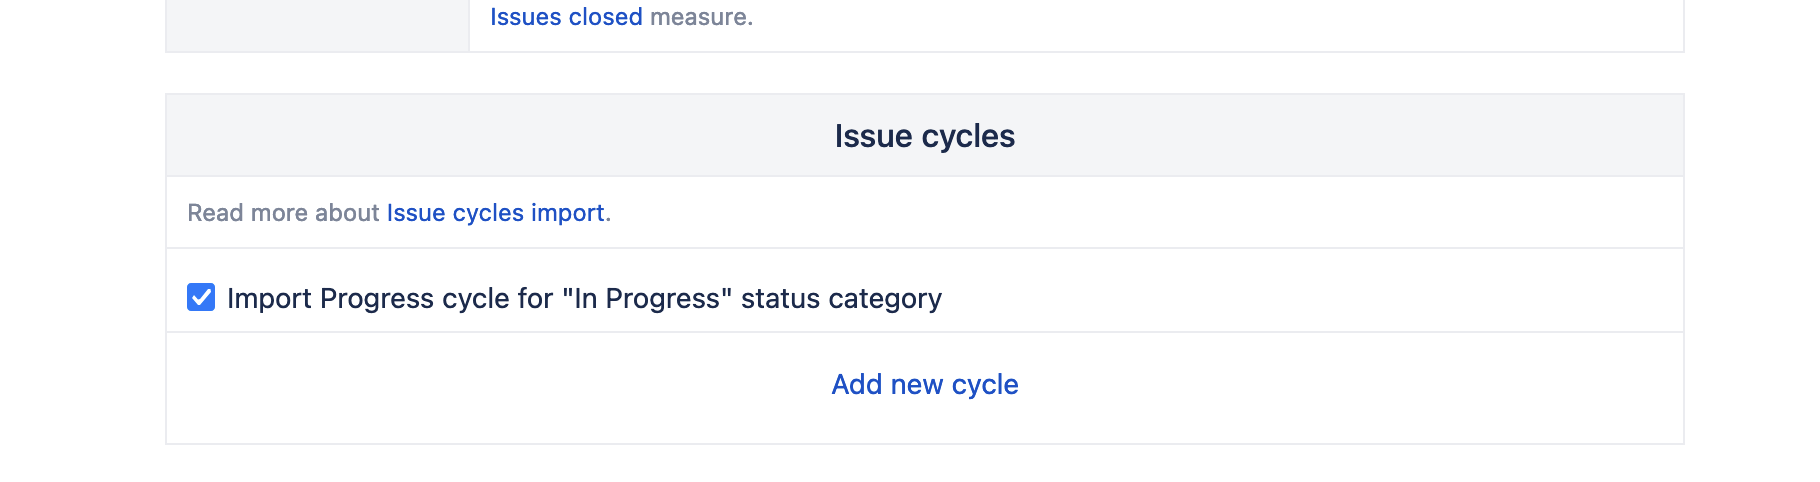
The recommended solution for this use case is to implement a custom cycle. You can define a custom cycle from all the statuses of the In Progress category or select the default option:
Hi @janis.plume
Is there a way to exclude the stories marked as “deleted” or “cancelled” from the calculation? Should we do it in the main data source filter?
Excluding unnecessary data with the JQL in the data import options is a good idea.
It should be also possible to exclude issue count in the formula. You may need to check how the Tuple works: Tuple
Hi, so we have used query “status not in (Deleted, Cancelled, Rejected, Duplicate)” and seemed to work for this specific filter for cycle time that you suggested, but it doesnt work for “average resolution days” filter using the same data source. It still shows up the deleted. Any suggestions?
Hi Janis,
one more question, I wanted to calculate the deviation for this average cycle time.
I have seen these formulas on other post.
Stdev(
Filter(Descendants([Issue].CurrentMember,[Issue].[Issue]),
not IsEmpty([Measures].[Item value])
),
[Measures].[Item value]
)
but they dotn seem to work for me. What should I change?
The formula can be impacted by the report context and how the Item value measure is built.
We need to see full details of the report you are building (a screenshot and the report definition).