Hello, eazyBI community,
Could you help me with scoping down the built-in measure “Average days in transition status”?
I have Rows: “Time” and “Transition Status”. As for Columns, I’m using the “Average days in transition status” measure. What would be the best way to show “Average days in transition status” only for the issues that were created after September 1, 2021?
Thanks,
Nicolas
Hi Nicolas
Welcome to eazyBI community.
In this case, you could try creating new user-defined calculated measure (with decimal format) to calcualte results only for issues created since Sep 1 2021
Sum(
  Filter(
  Descendants([Issue].CurrentHierarchyMember,[Issue].[Issue]),
    DateBetween(
      [Measures].[Issue created date],
      'Sep 1 2021', 'today'
    )
  ),
  CASE WHEN
  [Measures].[Average days in transition status]>0
  THEN
  [Measures].[Average days in transition status]
  END
)
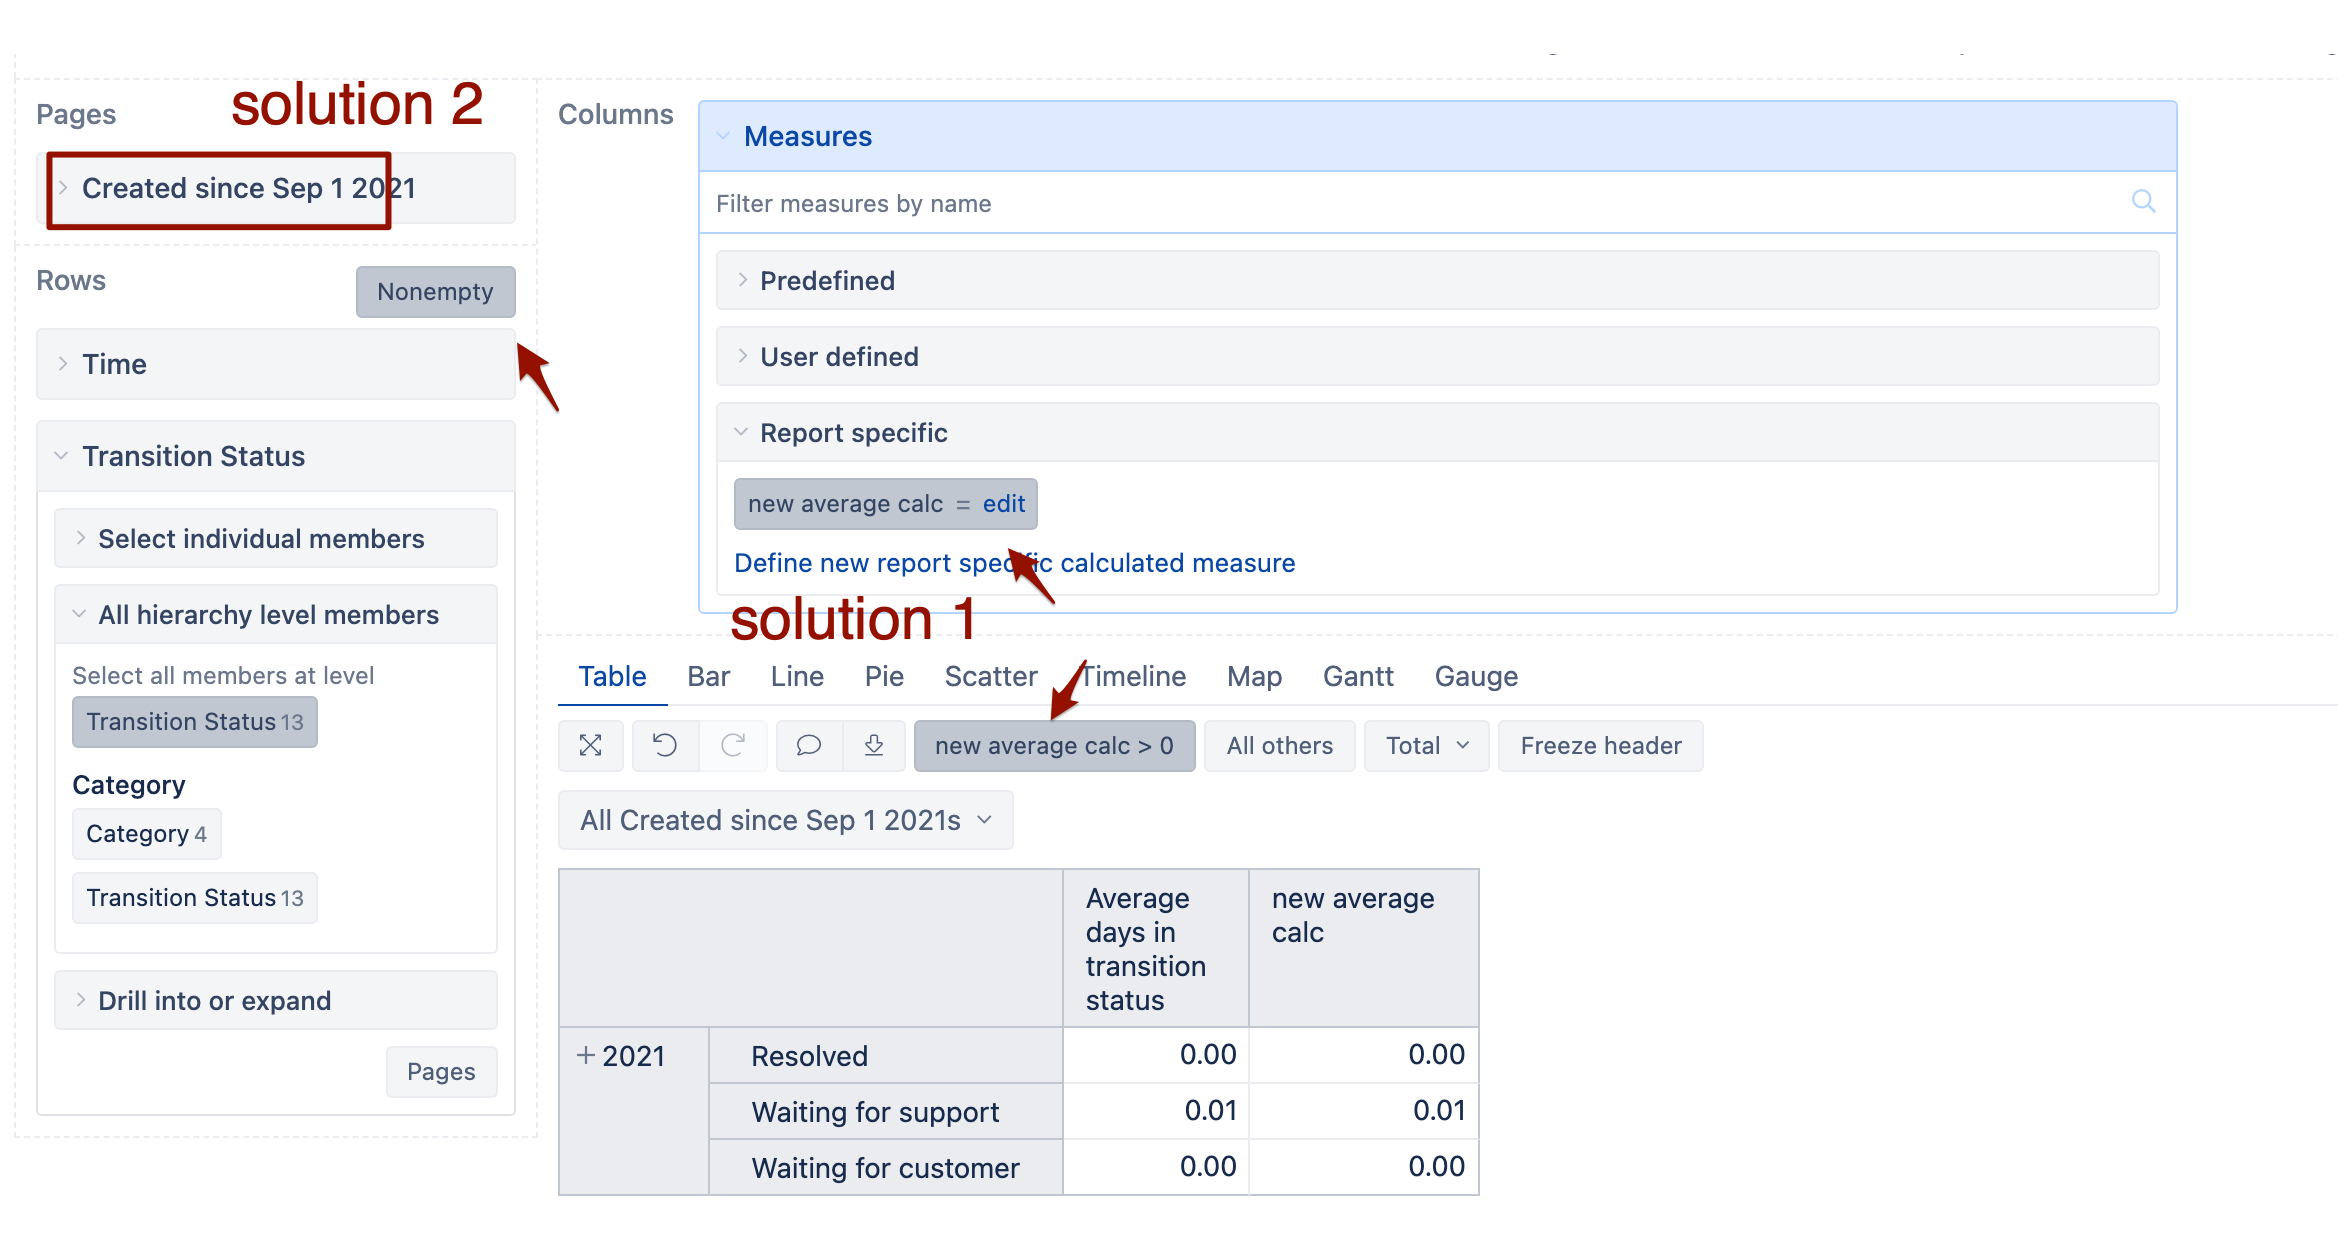
When selecting it in the report, please make sure you enable “Nonempty” cross join for report rows (image below)
If you notice performance issues with this calculation (because it iterates through all imported issues for every report row), there could be a faster way by introducing new pre-calculated field “Created since Sep 1 2021” by using Javascript on advanced settings and then importing it as separate dimension that would let you filter issues created after Sep 1 2021.
I used these advanced settings to define the field in my example (see image below)
[jira.customfield_crsince1Sep2021]
name = "Created since Sep 1 2021"
data_type = "string"
dimension = true
javascript_code = '''
var zbpStartDate = new Date(2021, 8, 1);
issue.fields.customfield_crsince1Sep2021 = new String(Date.parse(issue.fields.created) >= zbpStartDate);
'''
See more Javascript examples here:
https://docs.eazybi.com/eazybi/data-import/data-from-jira/jira-custom-fields/javascript-calculated-custom-fields
One more solution would be using JQL filter to skip older issues from import
But that approach would affect all reports on your eazyBI account
Martins / eazyBI
Hello @martins.vanags
Thank you for the help. In your initial formula example, did you mean “Avg”? As I can see “Sum” just combines all those average durations.
And the second question would be, how did you add “new average calc > 0” constraint? For me it looks different, it’s “Hide empty rows”. It works alright, but there are a few 0.00 rows.
Thanks,
Nicolas
@NicolasSiver
In original formula I meant “Sum” as formula which would return the sum of customer average workdays. If issue spent time in different status, then on issue level the average will be calculated from issue transitions, hovewer, the formula above would return the sum of such averages from all issues, that belong to the report set.
In the second question, I selected the measure “new average calc” in columns then used a filter by this column.
https://docs.eazybi.com/display/EAZYBI/Create+reports#Createreports-Orderandfilterrowsbymeasurevalues
Martins / eazyBI