Hi all,
we have an interesting request from our customer - they need a derivation report on
- plan derivation (PABW)
- cost derivation (KABW)
- resource derivation (RABW)
Plan derivation is a calculation of some date fields,
cost derivation is a calculation of some number fields and
resource derivation is also a calculation of some number fields.
The target is a spline report showing on a timeline - monthly, quarterly and yearly (project: LOKSP, issue type: AP-Service
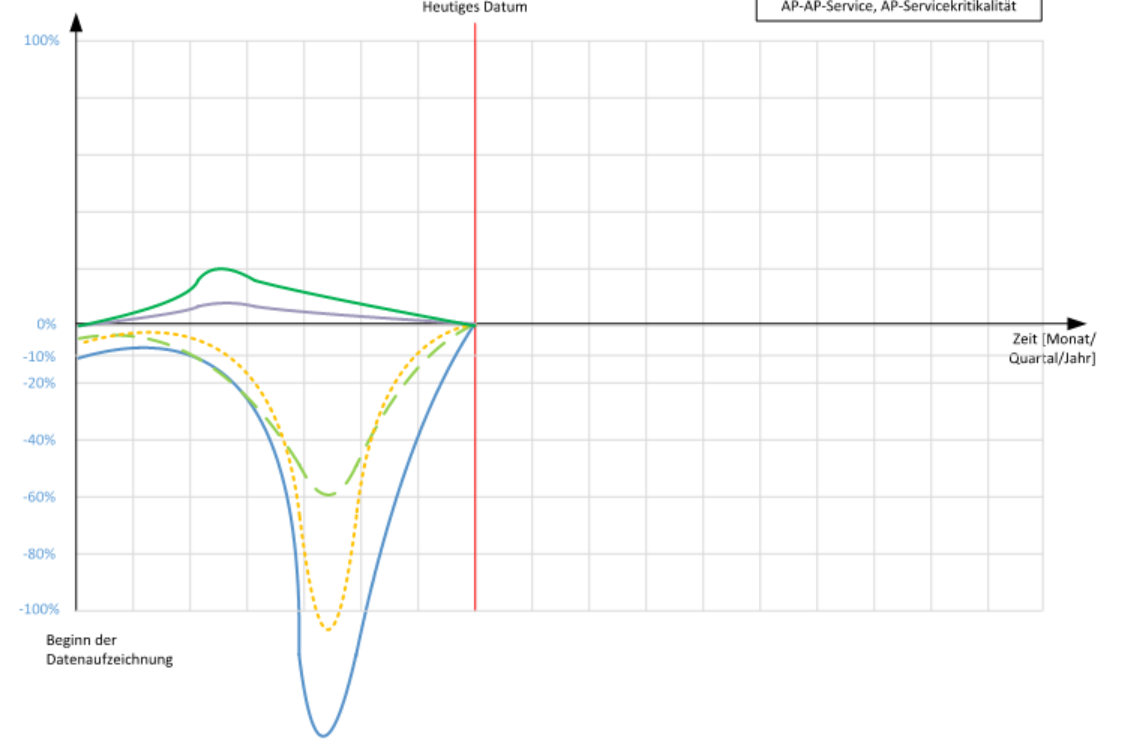
So we need the historical values used in the formulas showing the average value of the project, the table (base for the timeline report) should show somthing like this:
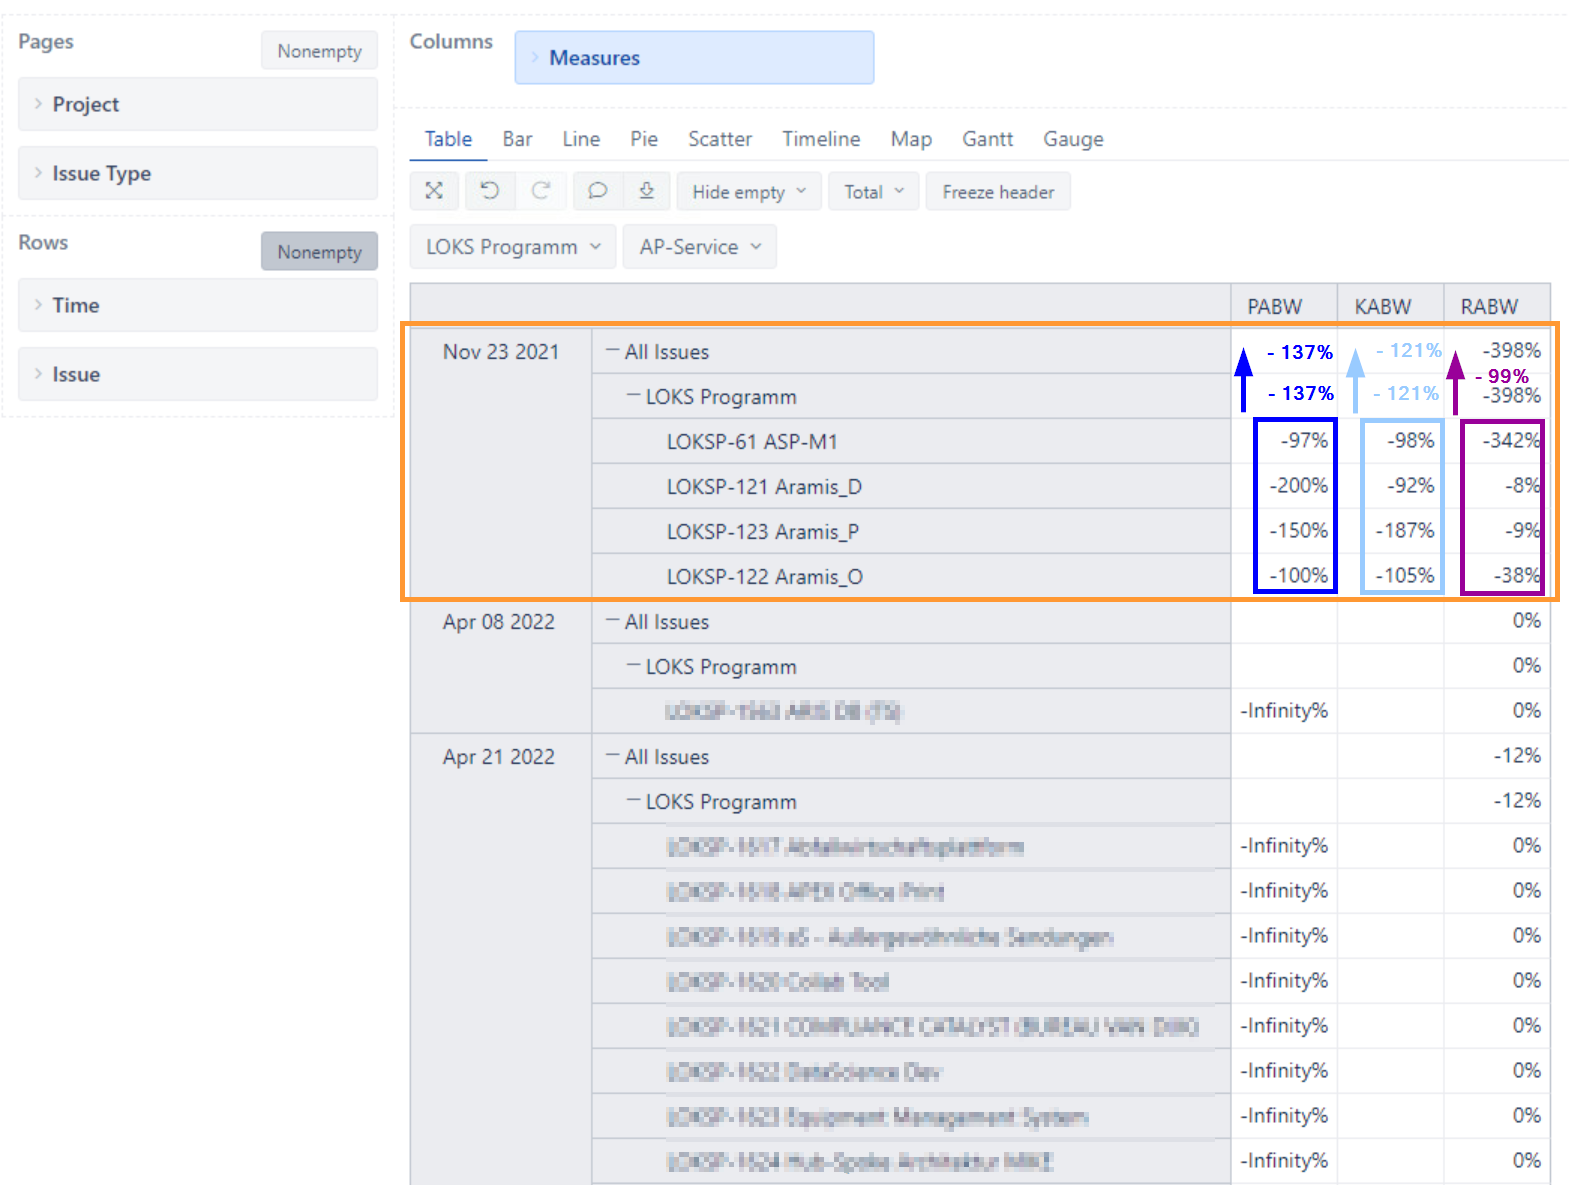
Here are the formulas used in the report:
PABW:
-1*([Measures].[Zeitfenster geplant (Werktage)]/[Measures].[Zeitfenster tatsächlich])
Zeitfenster geplant:
DateDiffWorkdays([Measures].[Issue Planned Start Date],[Measures].[Issue Planned End Date])
Zeitfenster tatsächlich:
DateDiffWorkdays([Measures].[Issue Tatsächlicher Start], [Measures].[Issue Tatsächliches Ende])
KABW:
-1*([Measures].[Issue IST Kosten]/[Measures].[Issue Budget geplant])
IST Kosten = real costs
Budget geplant = planned budget
RABW
-1*(([Measures].[Ressourcenverfügbarkeit intern]+[Measures].[Ressourcenverfügbarkeit extern]+[Measures].[Ressourcenverfügbarkeit BCC])/300)
Ressourcenverfügbarkeit intern = resource availability intern
Ressourcenverfügbarkeit BCC = resource availability BCC (a department)
All formulas are formatted as Integer percentage.
Is this the right approach? Is it even possible to do what the customer´s requirement says?
Thank you in advance!
Cheers
Radim