I’ve been trying many solutions to have an average of the results by month. This is the code that’s not working:
–annotations.group = Deployment Frequency
CASE WHEN [Time].CurrentHierarchyMember.Level.Name = ‘Month’
THEN
Avg(
[Time].CurrentHierarchyMember,
[Measures].[Deployment Frequency]
)
WHEN [Time].CurrentHierarchyMember.Level.Name = ‘Week’
THEN
Avg(
[Time].CurrentHierarchyMember,[Measures].[Deployment Frequency]
)
ELSE
Avg(
[Time].CurrentHierarchyMember,[Measures].[Deployment Frequency]
)
END
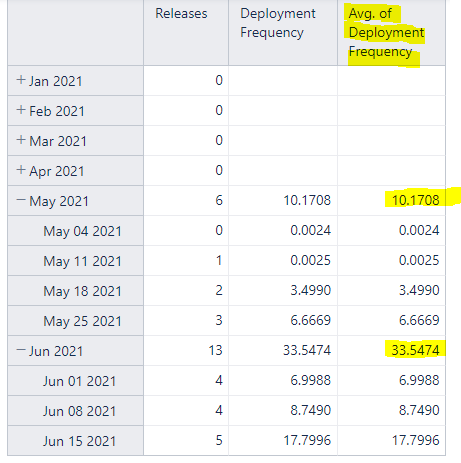
Even with the AVG being used the result is a SUM:
I’ve tried to make a division by the number of results as a workaround but with no success since I don’t know how to get the number of results being considered for the Time period. Example using Siblings (probably not the solution):
Avg(
[Time].CurrentHierarchyMember,[Measures].[Deployment Frequency]
) / count([Time].CurrentHierarchyMember.Siblings)
ELSE
Many thanks for all, stay healthy, stay safe
Danilo
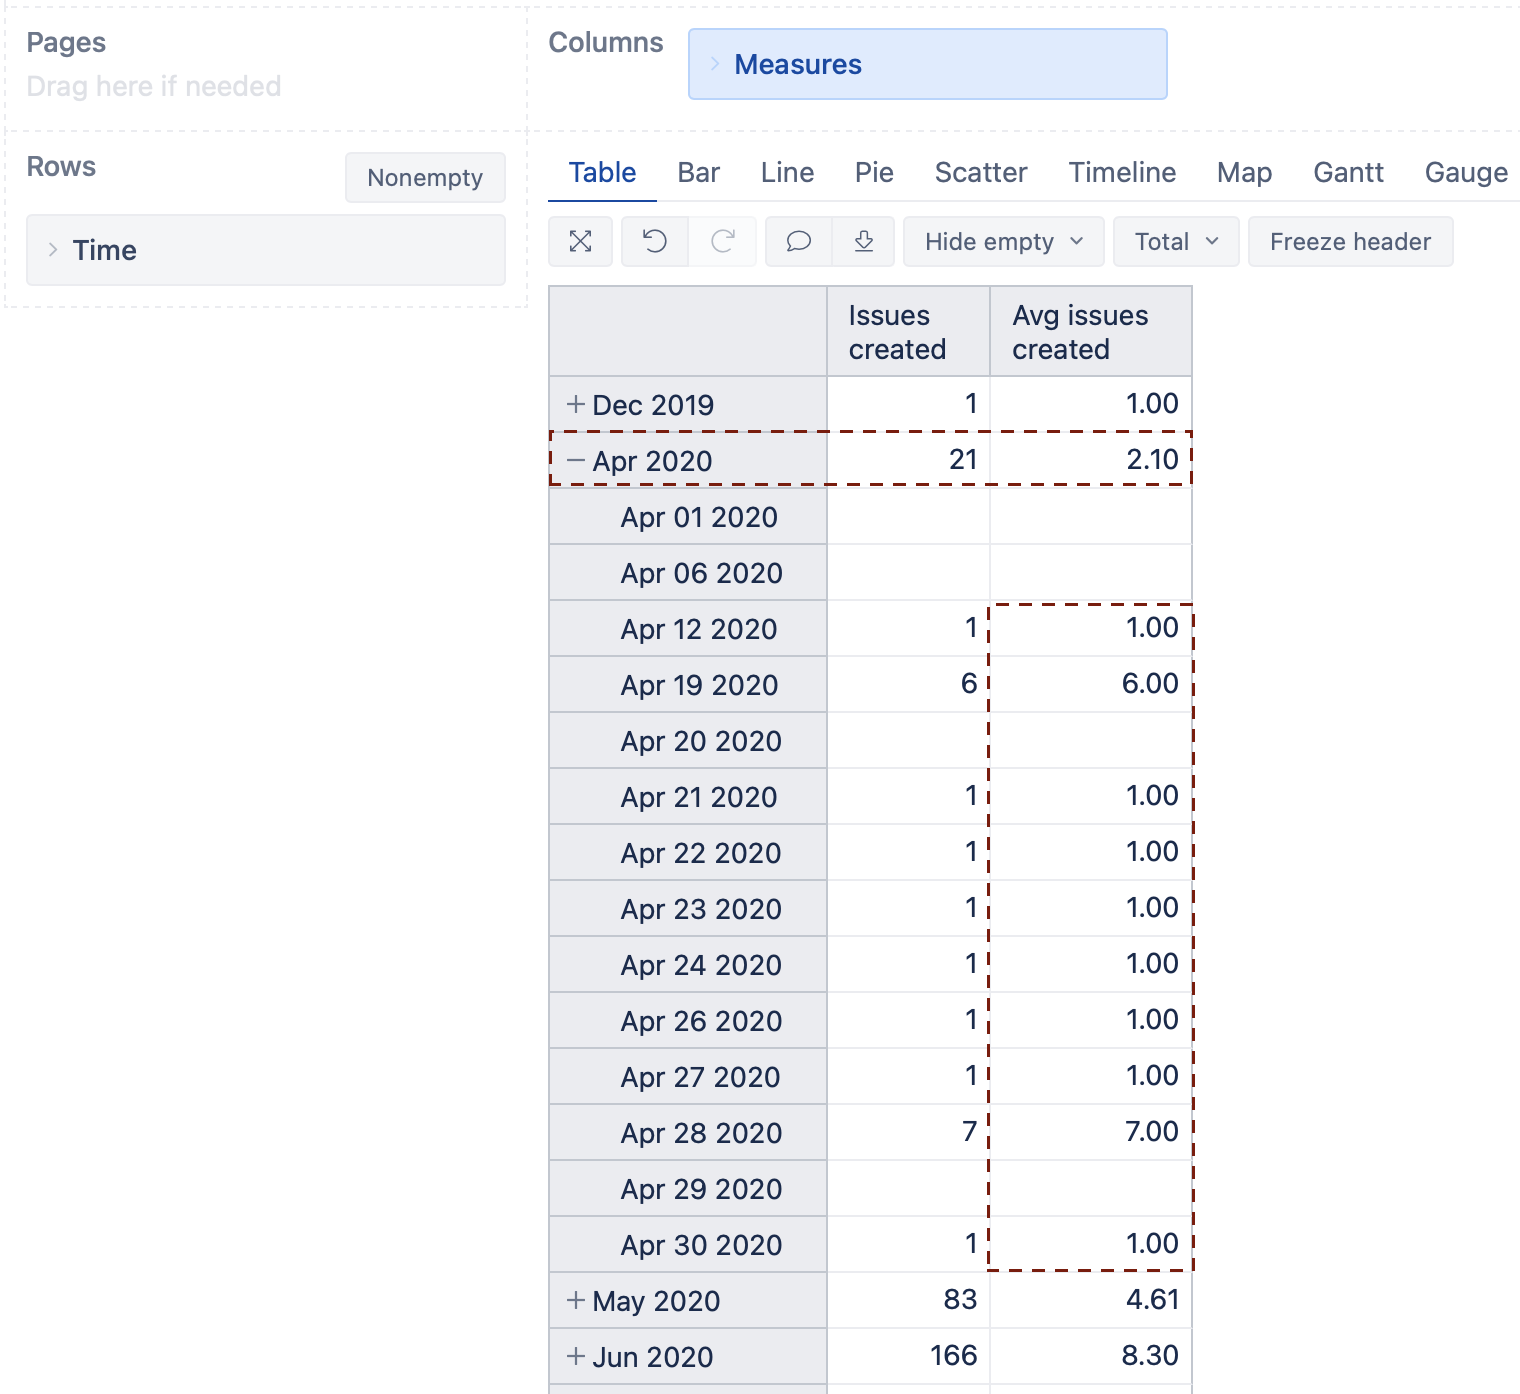
The Time dimension current hierarchy member in the formula will consider the Time dimension member currently in rows. Thus it will always be the total sum of the measure value in that period evaluated over that one member.
If you intend to use the “Month” or “Week” level members in rows and want to evaluate the total value for that period over the number of days there were values for the particular measure, the formula could look similar to the one below:
It all depends on how you have defined the TTR index and what other measures are involved in the calculation. It may be as simple as a division of the total TTR index with the number of issues - Calculated measures.
Or, the calculation may require iterating through the issues and using the Avg() function - Avg.
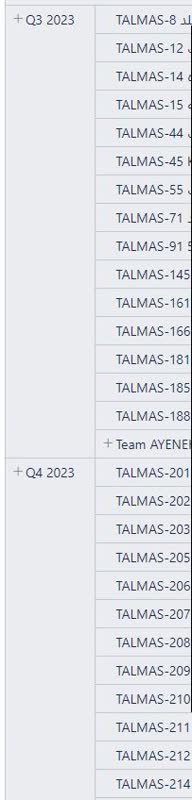
Nevertheless, I recommend removing the Issue dimension from the report rows or selecting the “All” member instead of “Issue” and “Project” levels to see the total value for the quarter and instead use “Drill through issues” to see individual issues.