I am trying to create a report that shows which day of the week on average are the busiest
So we can assign capacity on set days based on volumes of active cases.
I created a calculated member that gives me the name of the day but I am not sure where to go from there to create a report that shows an average of each day.
Hi @shafiek.bloew
Starting from eazyBI version 6.0, there is a default dimension Week day . Select it together with measure “Issues created” (or another that indicates how busy is the day) and combine with Time dimension if you are interested in a particular time period.
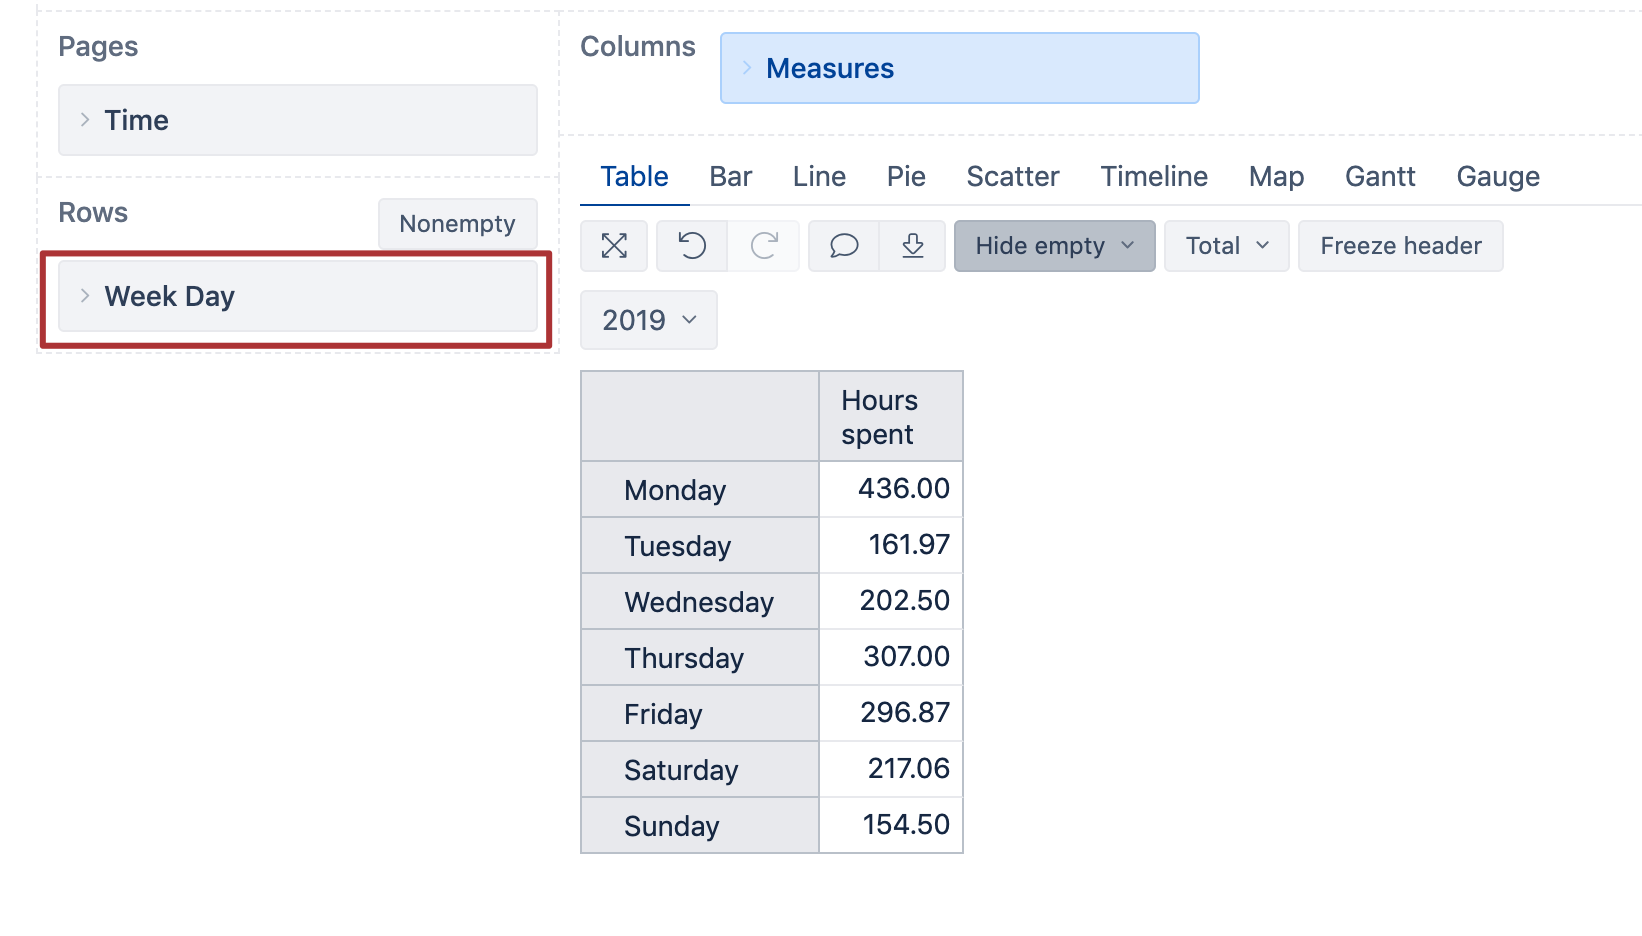
In the example below, the report shows how many hours are logged by weekdays during 2019:
Ilze, support@eazybi.com