Hi there,
I am trying to calculate the average number of Transitions per internal assignee and also per assignee as displayed in the below screenshot.
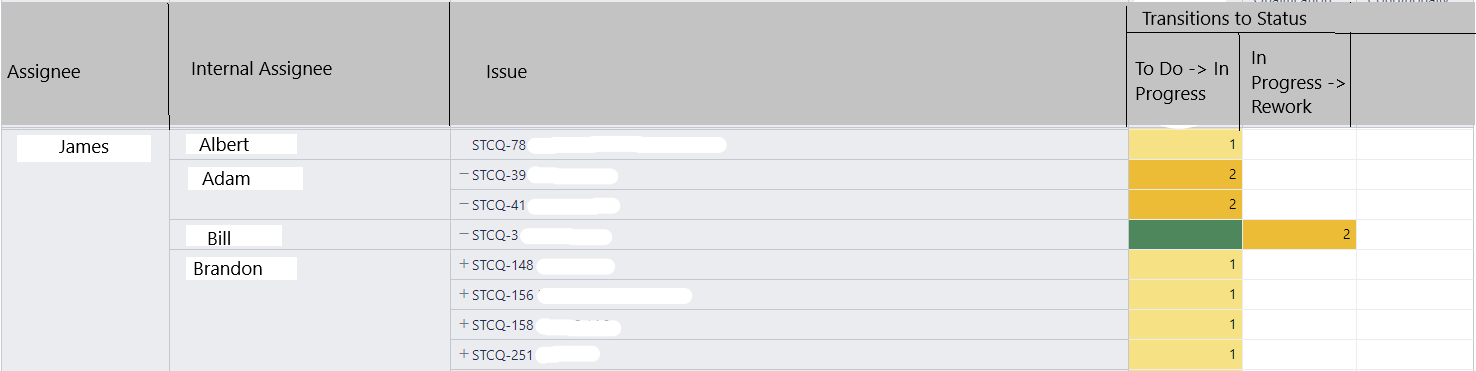
Here, I want a column that displays the average number of transitions (To do -> In Progress) per “Internal assignee”.
For example:
Adam-
*the average number of To Do -> In Progress transitions would be (2+2)/2 = 2,
*the average number of In Progress -> In Rework transitions would be blank
Brandon - It will be (1+1+1+1)/4 = 1 and blank respectively.
Similarly, I would need it per “Assignee” as well.
So, for James, the average number of To Do -> In Progress transitions would be 9/8 = 1.125
the average number of In Progress -> In Rework transitions would be blank 2/8 = 0.25
Could you please help me out here. Is this possible? or should it be the other way?
Thanks,
Keerthana.