Background: I need to report on how often an issue was transitioned more than once to a particular status during its lifecycle, the assumption being that if it was transitioned to this status more than once, something didn’t go to plan (ie. it had to be backtracked and re-worked on).
Eg. During October 2019, 50 issues were resolved, and the average number of times these issues were transitioned into the ‘QA’ status was 1.5.
Hope this makes sense, any pointers would be appreciated.
One way how to achieve this would be to create a new calculated measure that calculates the average number of times the resolved issues went through each transition status. Please have a look at the formula below:
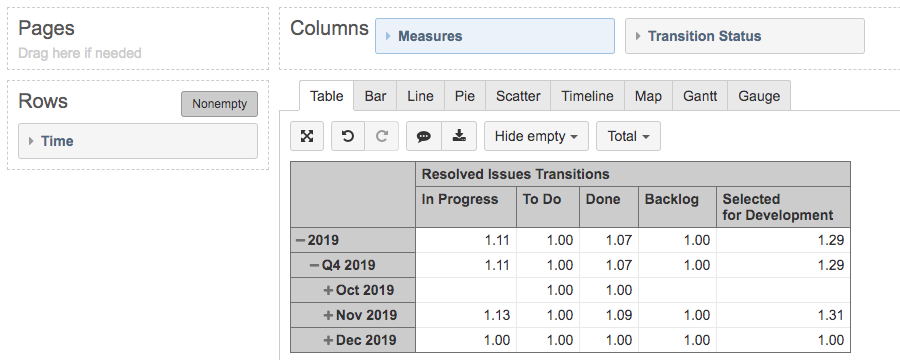
Then you can select the Transition Status dimension in columns and the Time dimension in rows. The measure then would display the average times all the issues resolved in that time period transitioned to the specific statuses in the columns. Please have a look at the picture of a sample report below: